#DataDrivenDevOps ”Without data you are just another person with an opinion” W. Edwards Deming @jbaruch #CincyDeliver #DataDrivenDevOps http://jfrog.com/shownotes
Slide 1
Slide 2
shownotes http://jfrog.com/shownotes Slides Video Links Comments, Ratings Raffle @jbaruch #CincyDeliver #DataDrivenDevOps http://jfrog.com/shownotes
Slide 3

Cobbler’s children have no shoes
Slide 4
Poll time! How many of you are software engineers? How many of you are optimists? How many of you are self-confident in their work? @jbaruch #CincyDeliver #DataDrivenDevOps http://jfrog.com/shownotes
Slide 5
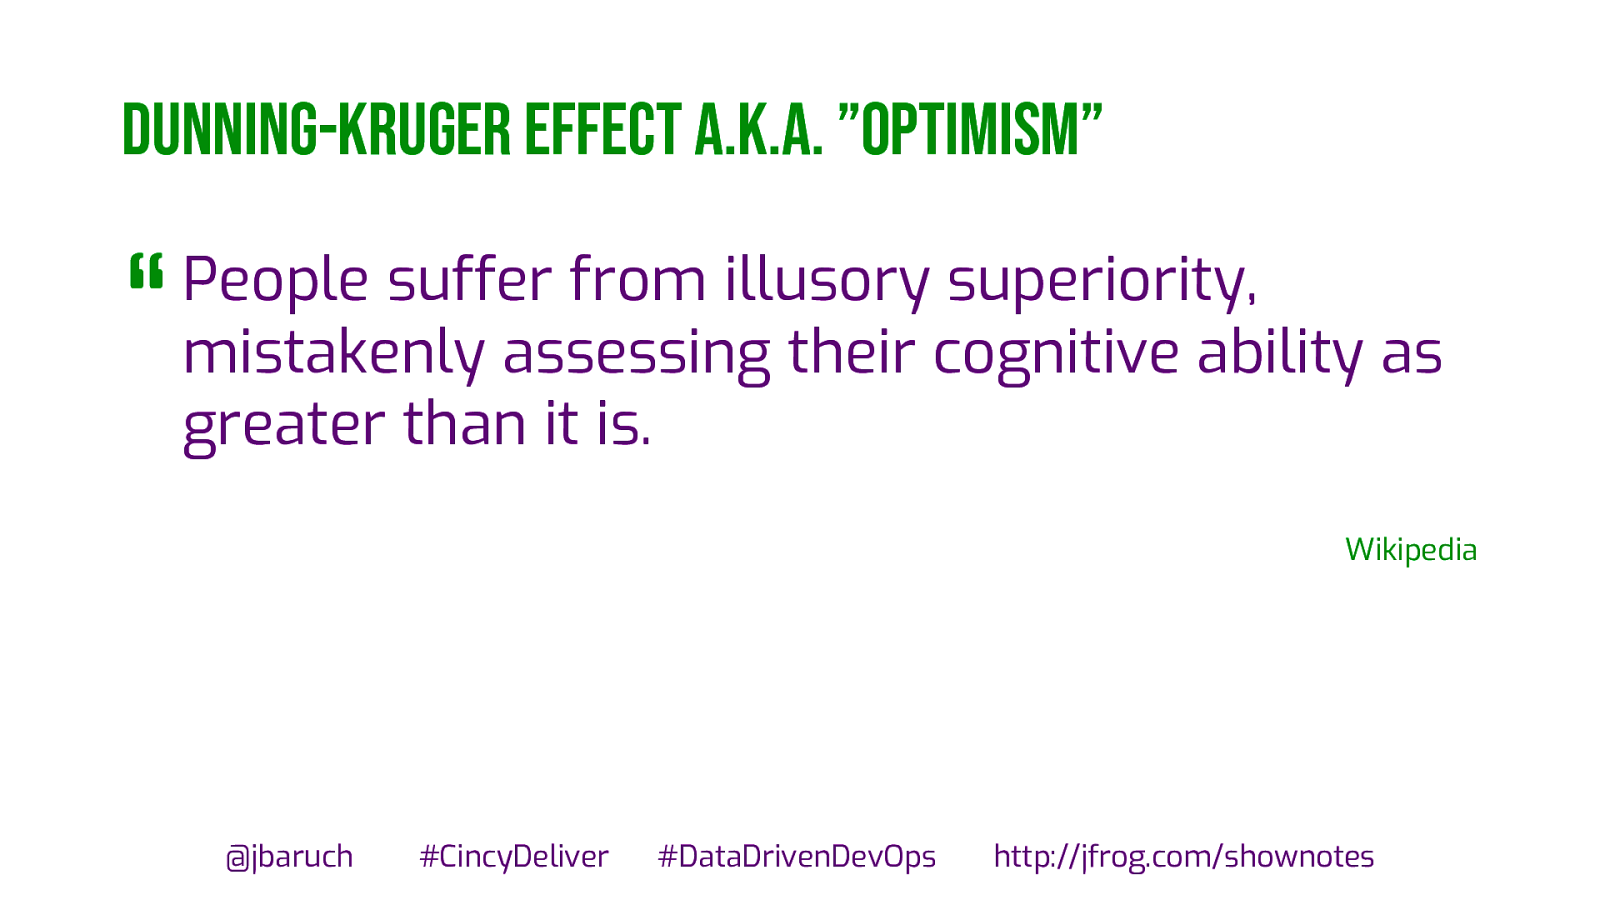
Dunning-Kruger Effect a.k.a. ”optimism” “ People suffer from illusory superiority, mistakenly assessing their cognitive ability as greater than it is. Wikipedia @jbaruch #CincyDeliver #DataDrivenDevOps http://jfrog.com/shownotes
Slide 6
Second-system effect a.k.a. “self-confidence” “ The tendency of small, elegant, and successful systems, to be succeeded by overengineered, bloated systems, due to inflated expectations and overconfidence. The Mythical Man-Month @jbaruch #CincyDeliver #DataDrivenDevOps http://jfrog.com/shownotes
Slide 7
The consequences @jbaruch #CincyDeliver #DataDrivenDevOps http://jfrog.com/shownotes
Slide 8
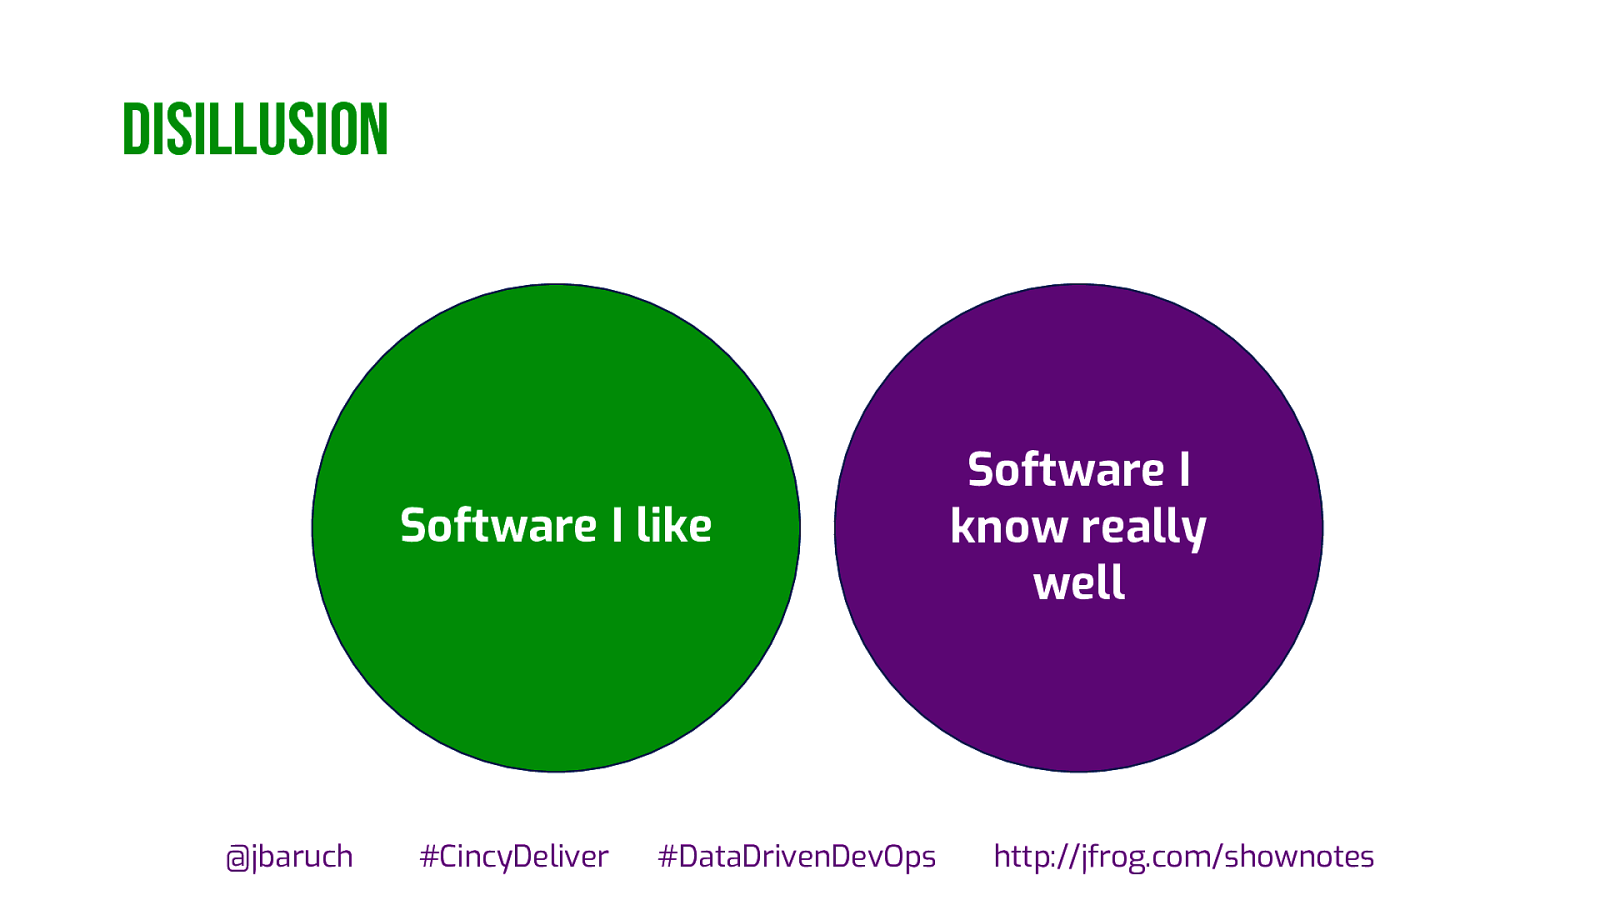
disillusion Software I like @jbaruch #CincyDeliver #DataDrivenDevOps Software I know really well http://jfrog.com/shownotes
Slide 9
overconfidence “ Every software is 80% ready 80% of the time Every developer, ever @jbaruch #CincyDeliver #DataDrivenDevOps http://jfrog.com/shownotes
Slide 10
Hard to give up @jbaruch #CincyDeliver #DataDrivenDevOps http://jfrog.com/shownotes
Slide 11
@jbaruch #CincyDeliver #DataDrivenDevOps http://jfrog.com/shownotes
Slide 12

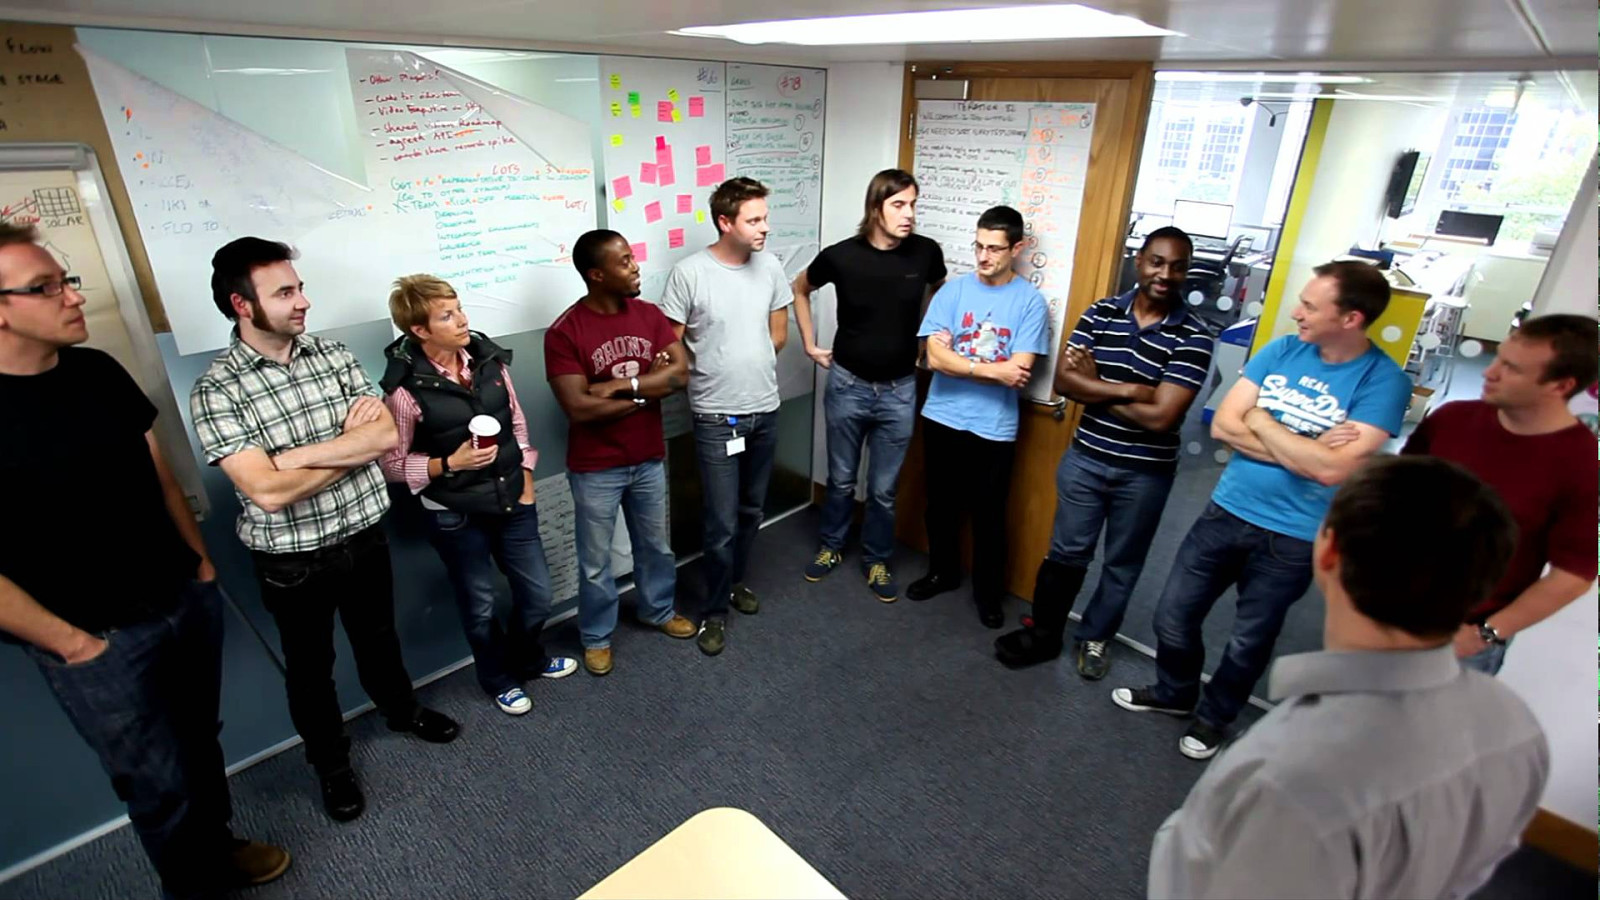
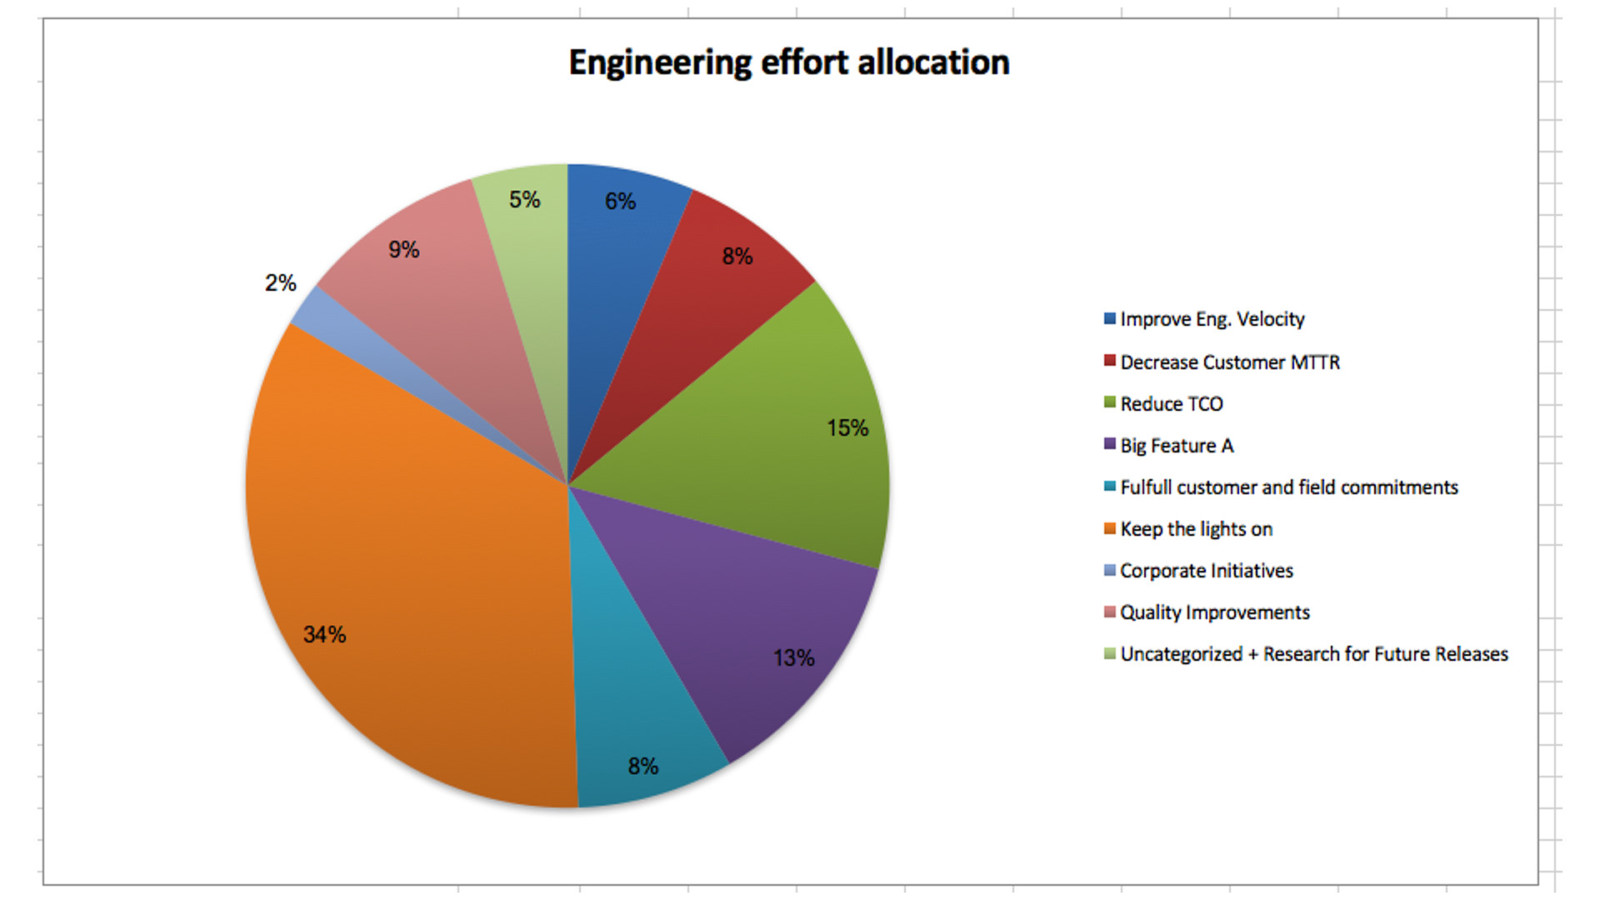
How departments measure Support Marketing Sales HR Finance @jbaruch #CincyDeliver Engineering Anecdotes from daily standup #DataDrivenDevOps http://jfrog.com/shownotes
Slide 13
@jbaruch #CincyDeliver #DataDrivenDevOps http://jfrog.com/shownotes
Slide 14
Slide 15
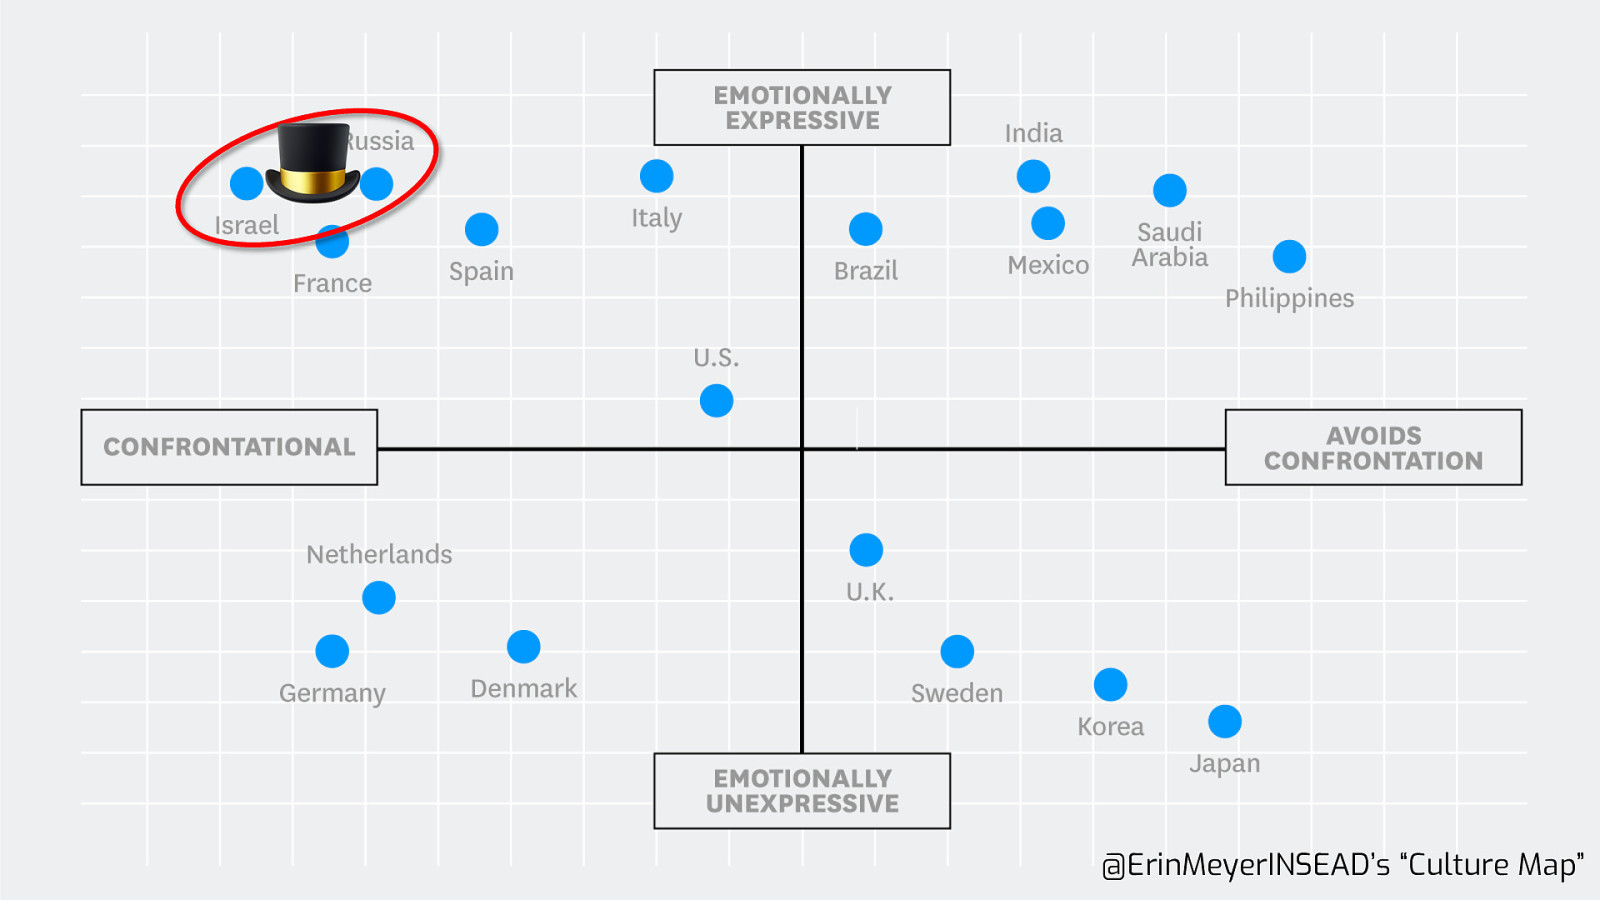
🎩 @jbaruch #dockercon jfrog.com/shownotes @ErinMeyerINSEAD’s “Culture Map”
Slide 16
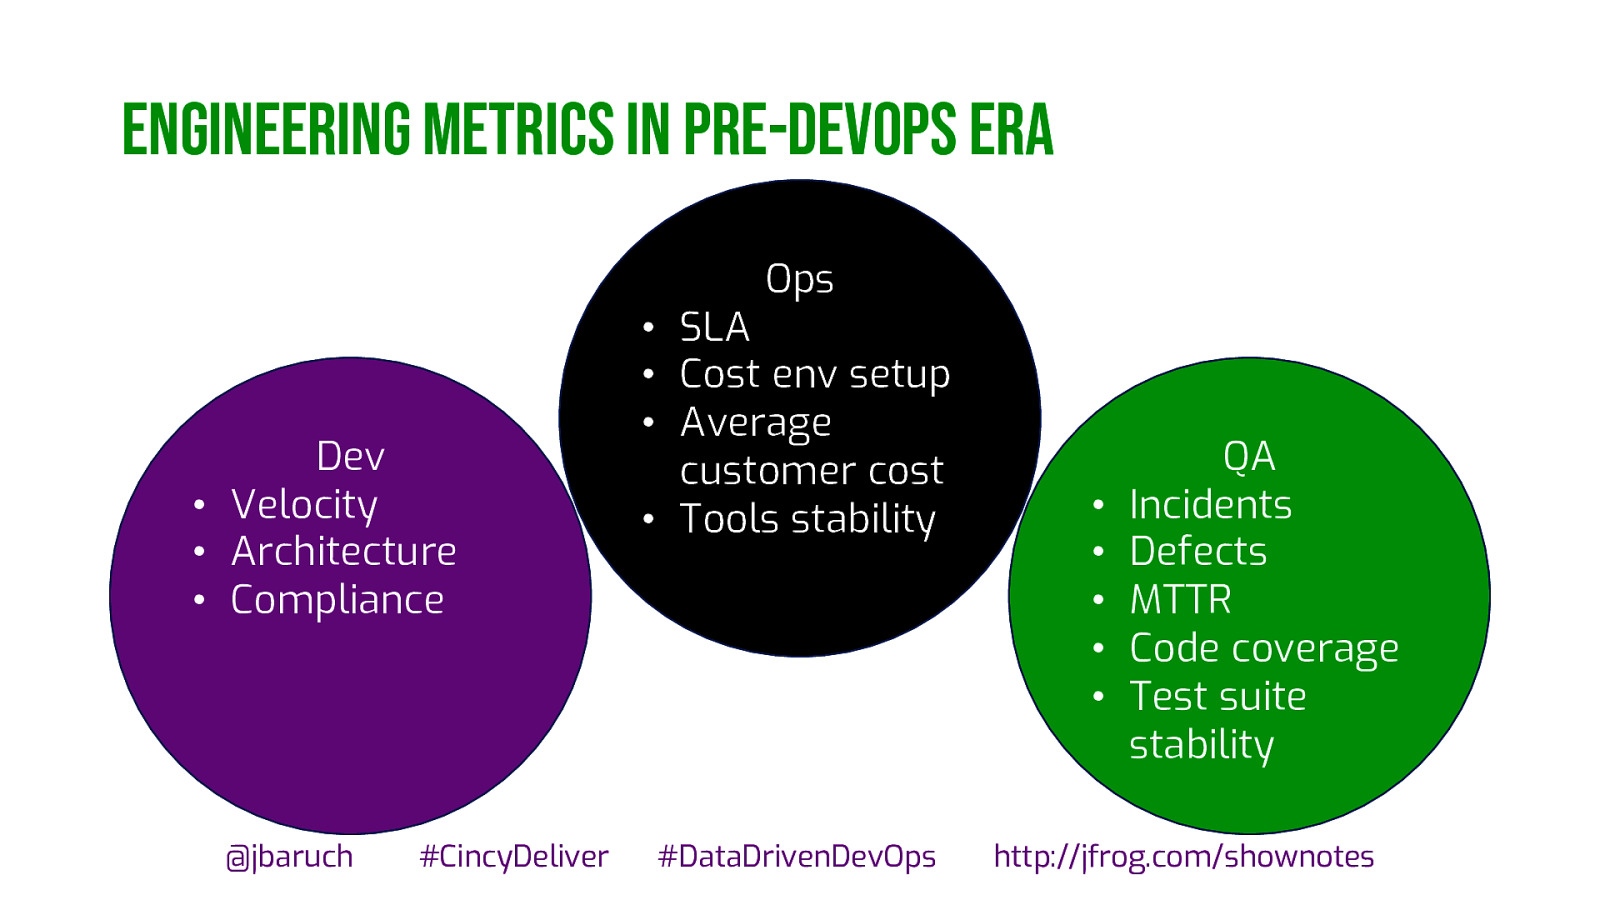
Engineering metrics in pre-devops era Ops Dev • Velocity • Architecture • Compliance @jbaruch #CincyDeliver • SLA • Cost env setup • Average customer cost • Tools stability #DataDrivenDevOps • • • • • QA Incidents Defects MTTR Code coverage Test suite stability http://jfrog.com/shownotes
Slide 17
DEVOPS! ? @jbaruch #CincyDeliver #DataDrivenDevOps http://jfrog.com/shownotes
Slide 18
Velocity to agile is like ? To devops… ? @jbaruch #CincyDeliver #DataDrivenDevOps http://jfrog.com/shownotes
Slide 19
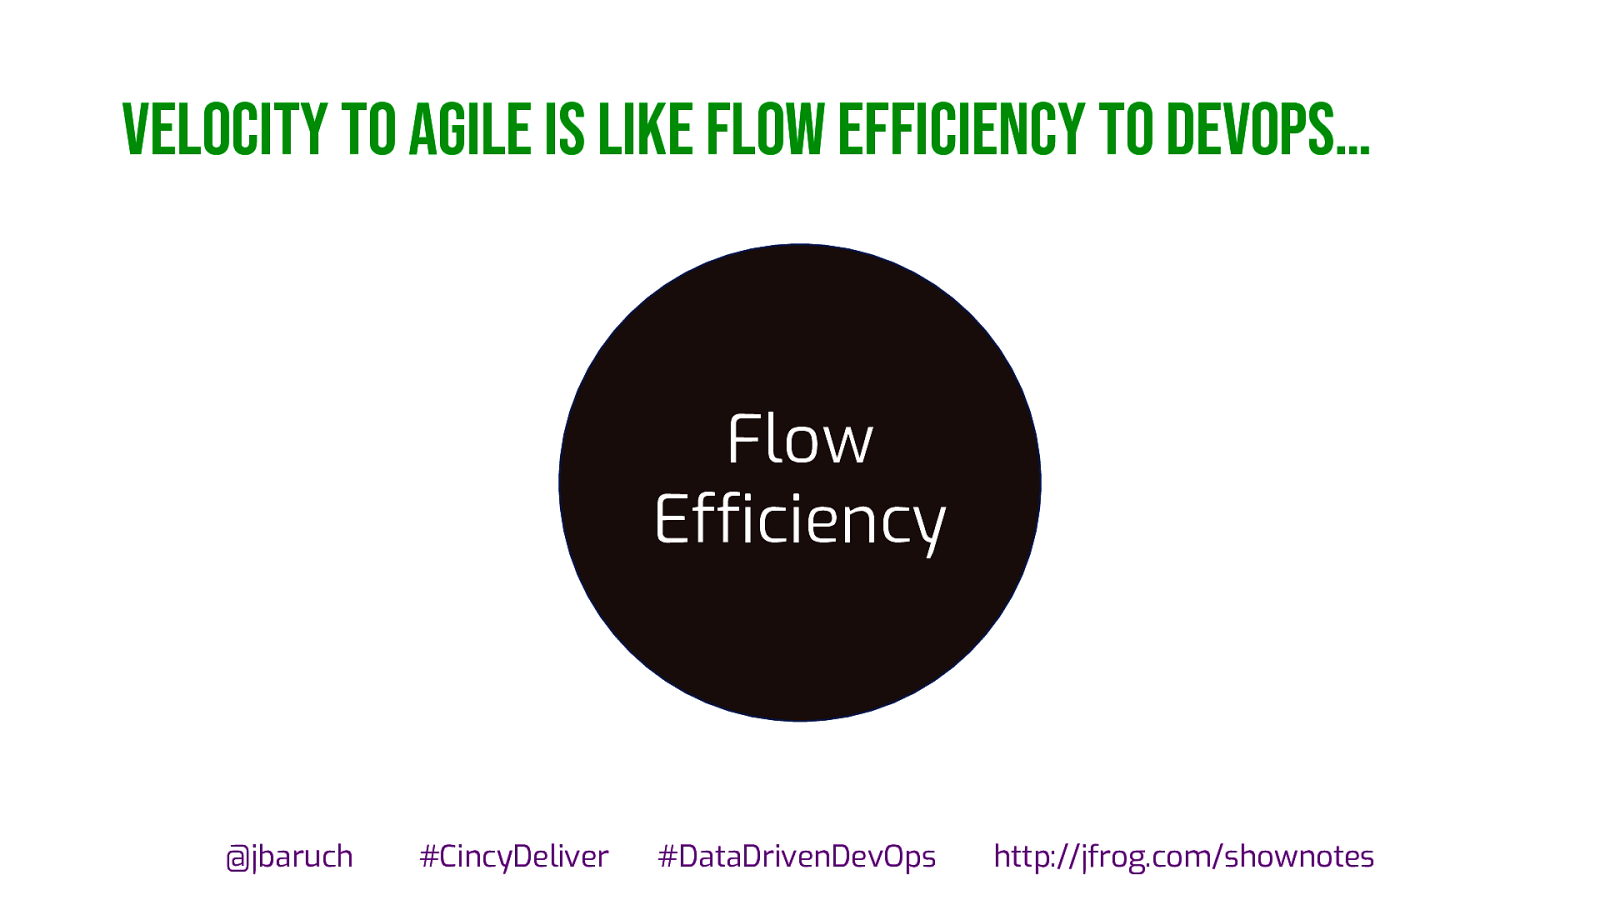
Velocity to agile is like Flow Efficiency To devops… Flow Efficiency @jbaruch #CincyDeliver #DataDrivenDevOps http://jfrog.com/shownotes
Slide 20
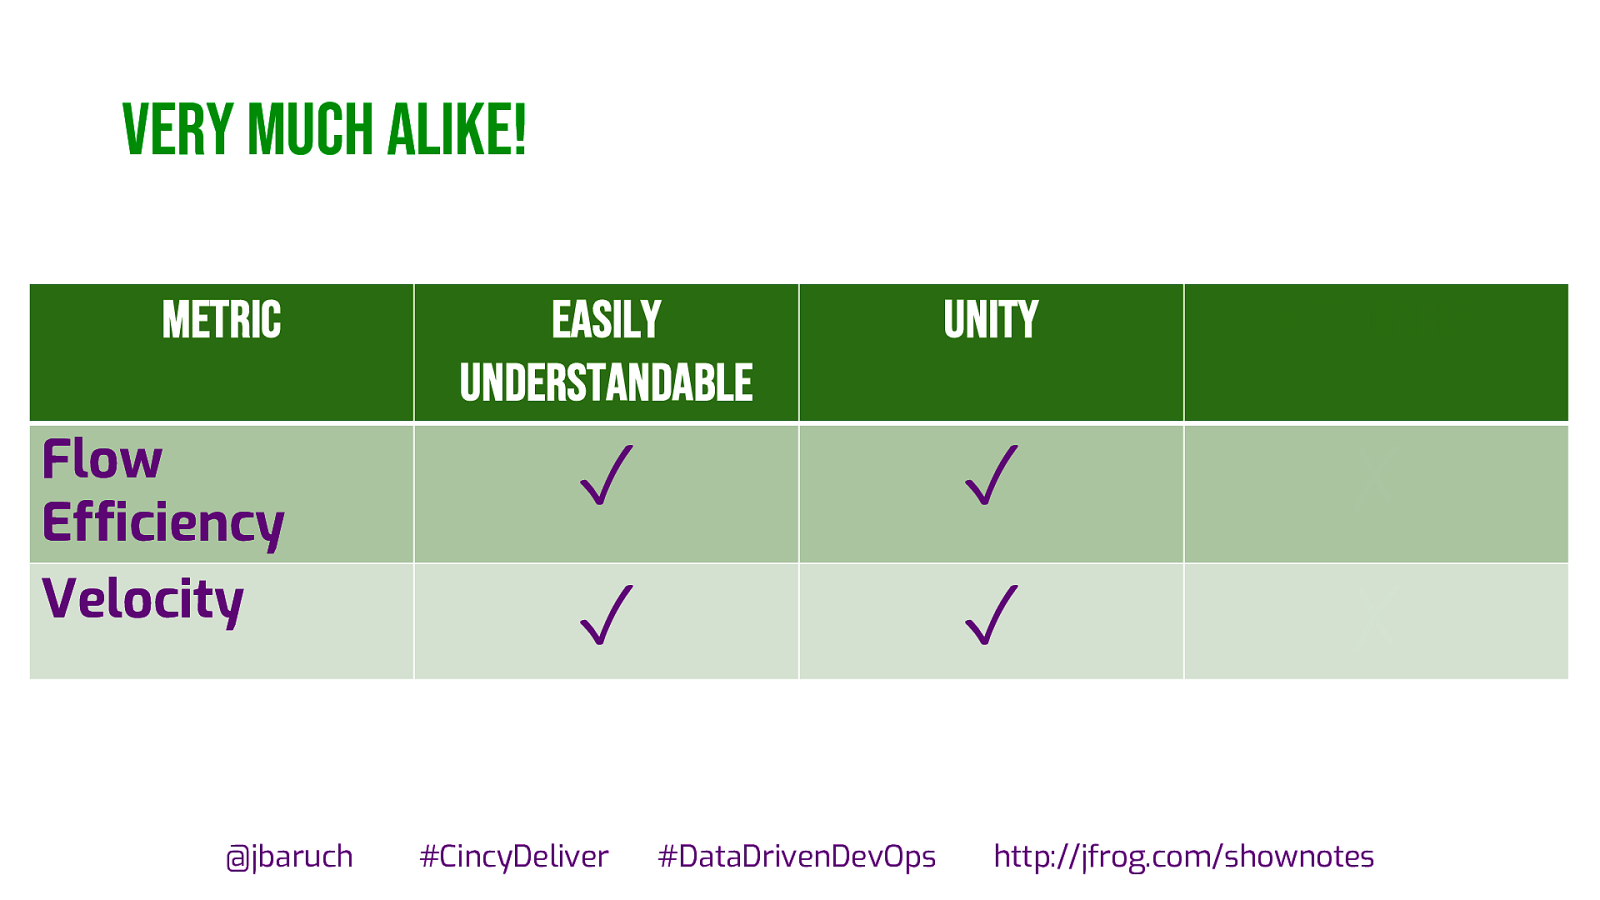
Very much alike! Metric Flow Efficiency Velocity @jbaruch Easily understandable Unity actionable ✓ ✓ ✗ ✓ ✓ ✗ #CincyDeliver #DataDrivenDevOps http://jfrog.com/shownotes
Slide 21
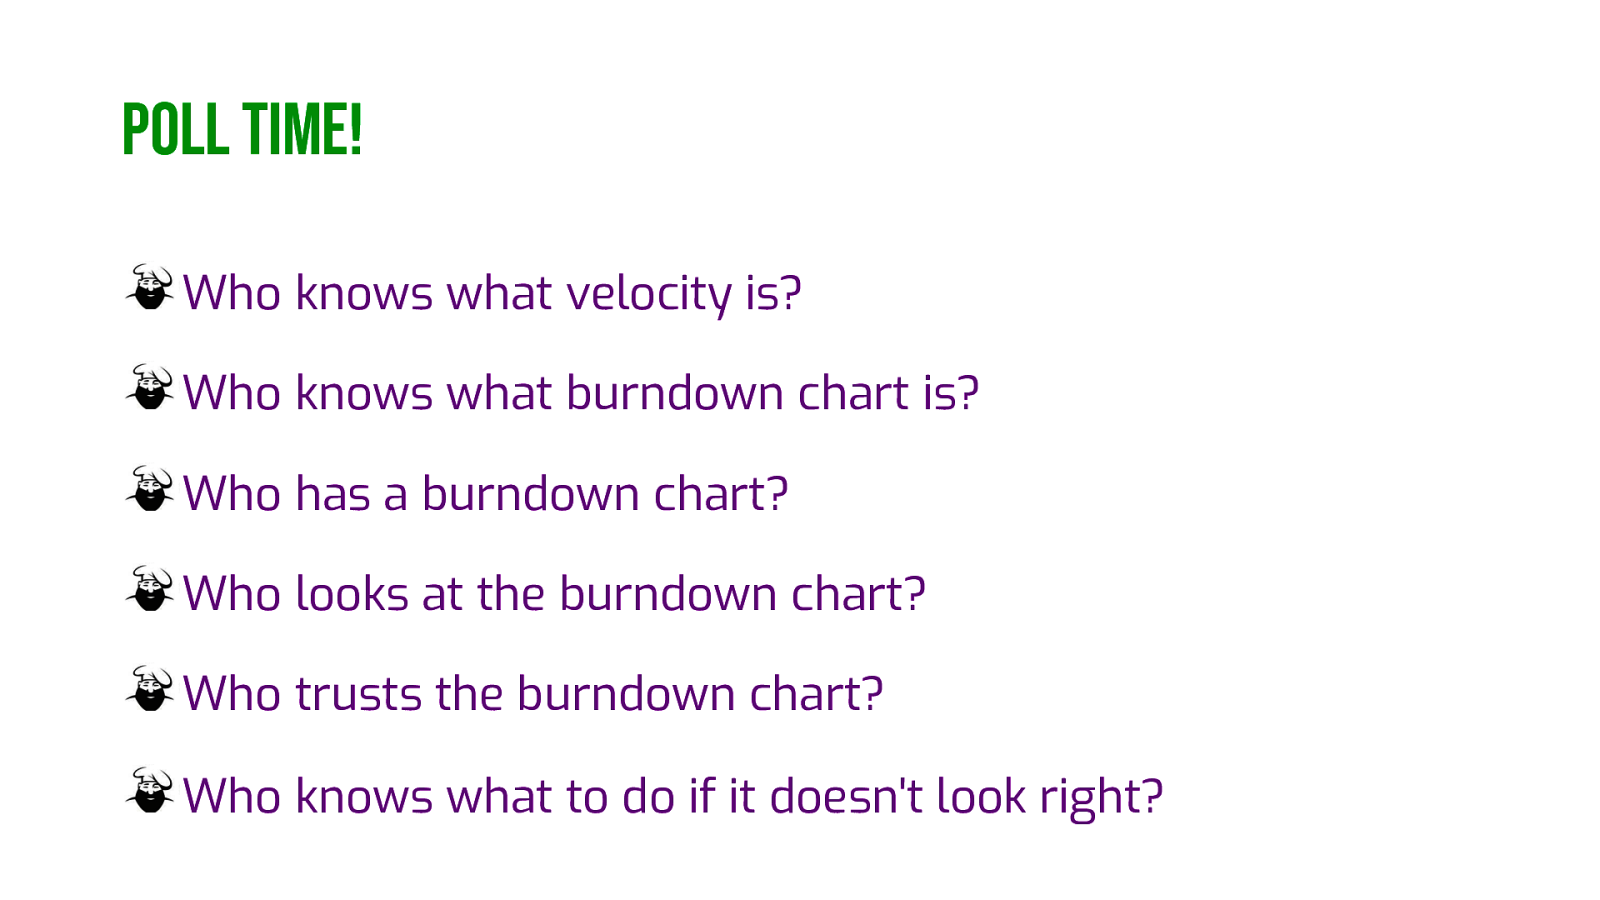
Poll time! Who knows what velocity is? Who knows what burndown chart is? Who has a burndown chart? Who looks at the burndown chart? Who trusts the burndown chart? Who knows what to do if it doesn’t look right?
Slide 22
What’s the problem? Velocity @jbaruch #CincyDeliver #DataDrivenDevOps http://jfrog.com/shownotes
Slide 23
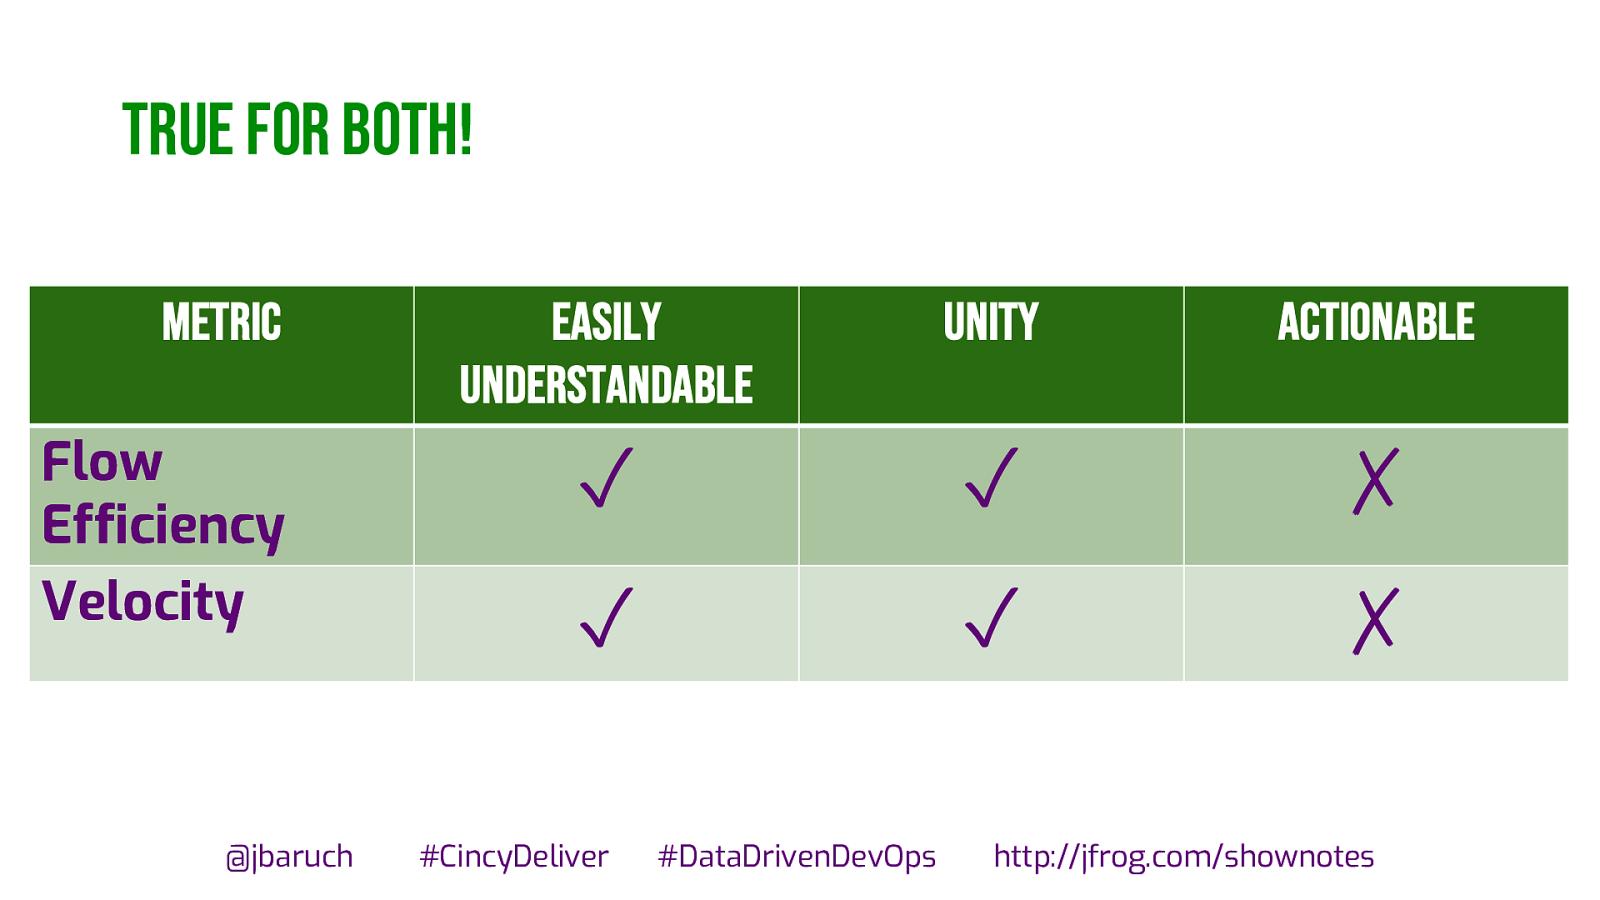
True for both! Metric Flow Efficiency Velocity @jbaruch Easily understandable Unity actionable ✓ ✓ ✗ ✓ ✓ ✗ #CincyDeliver #DataDrivenDevOps http://jfrog.com/shownotes
Slide 24
Too coarse! Flow Efficiency @jbaruch #CincyDeliver #DataDrivenDevOps http://jfrog.com/shownotes
Slide 25

Too coarse! DevOps @jbaruch #CincyDeliver #DataDrivenDevOps http://jfrog.com/shownotes
Slide 26
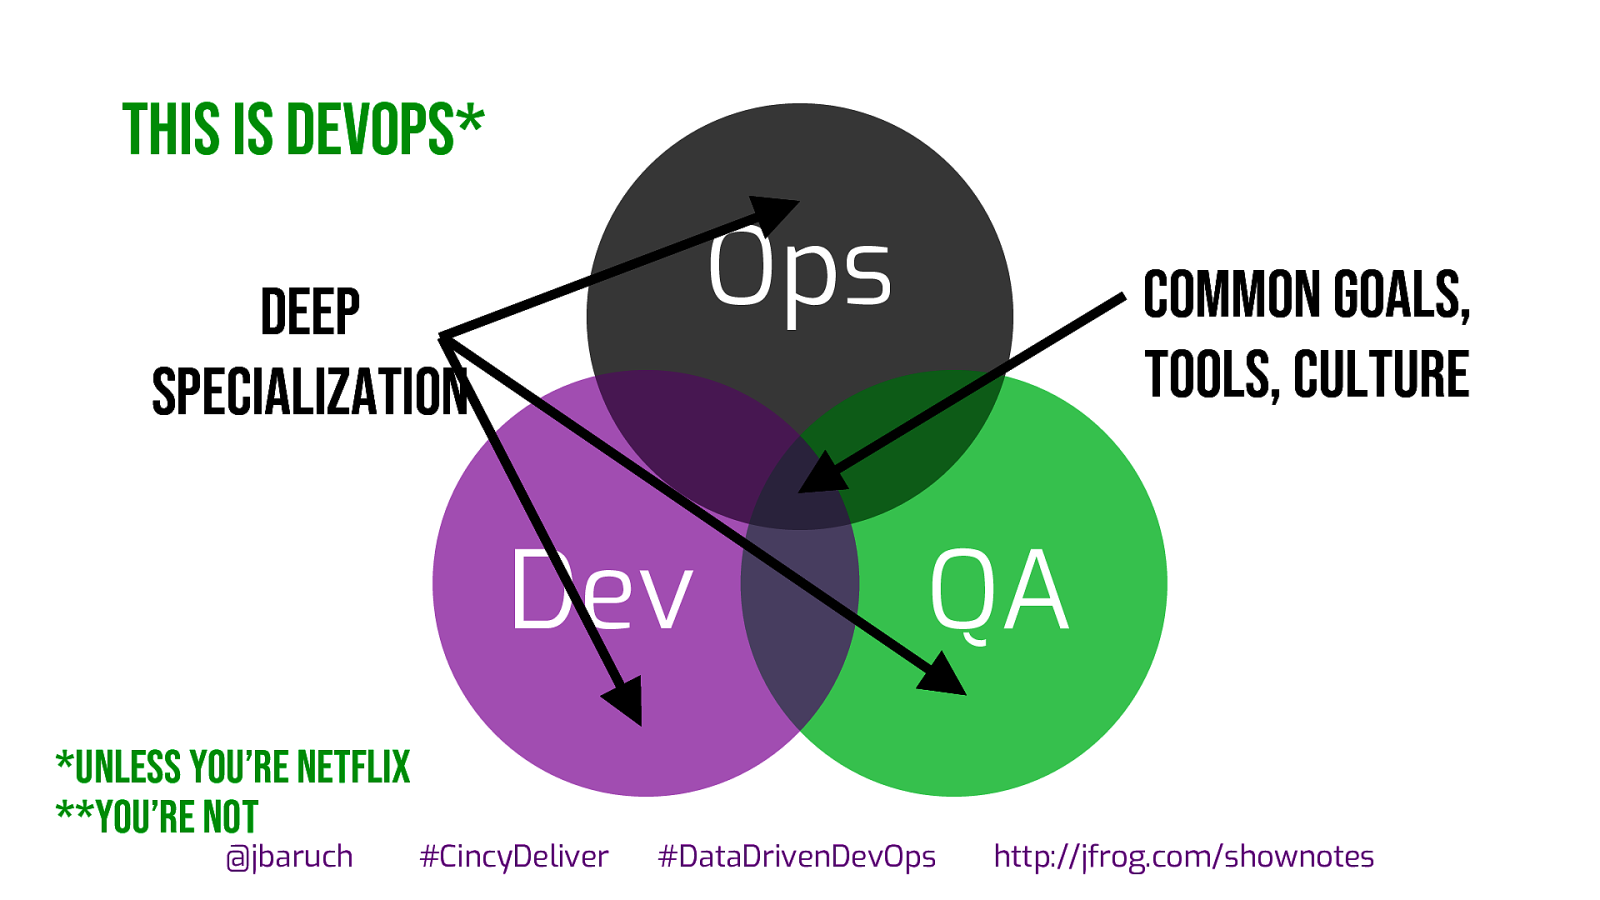
This is devops* Ops Deep specialization Dev *Unless you’re netfliX **You’re not @jbaruch #CincyDeliver Common goals, tools, culture QA #DataDrivenDevOps http://jfrog.com/shownotes
Slide 27
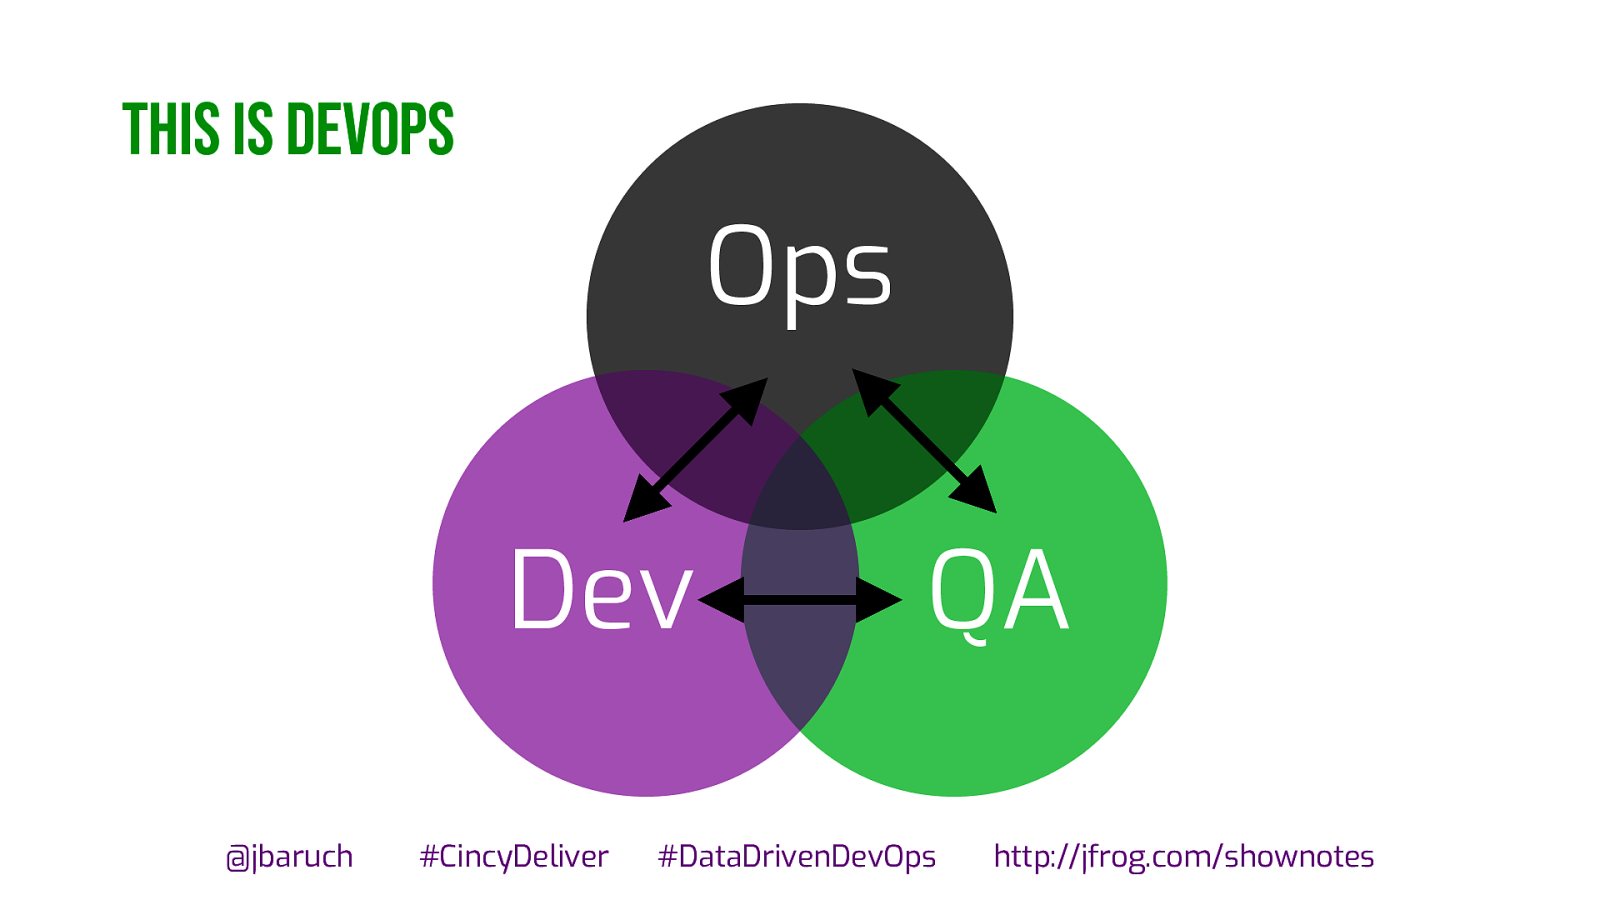
This is devops Ops Dev @jbaruch #CincyDeliver QA #DataDrivenDevOps http://jfrog.com/shownotes
Slide 28
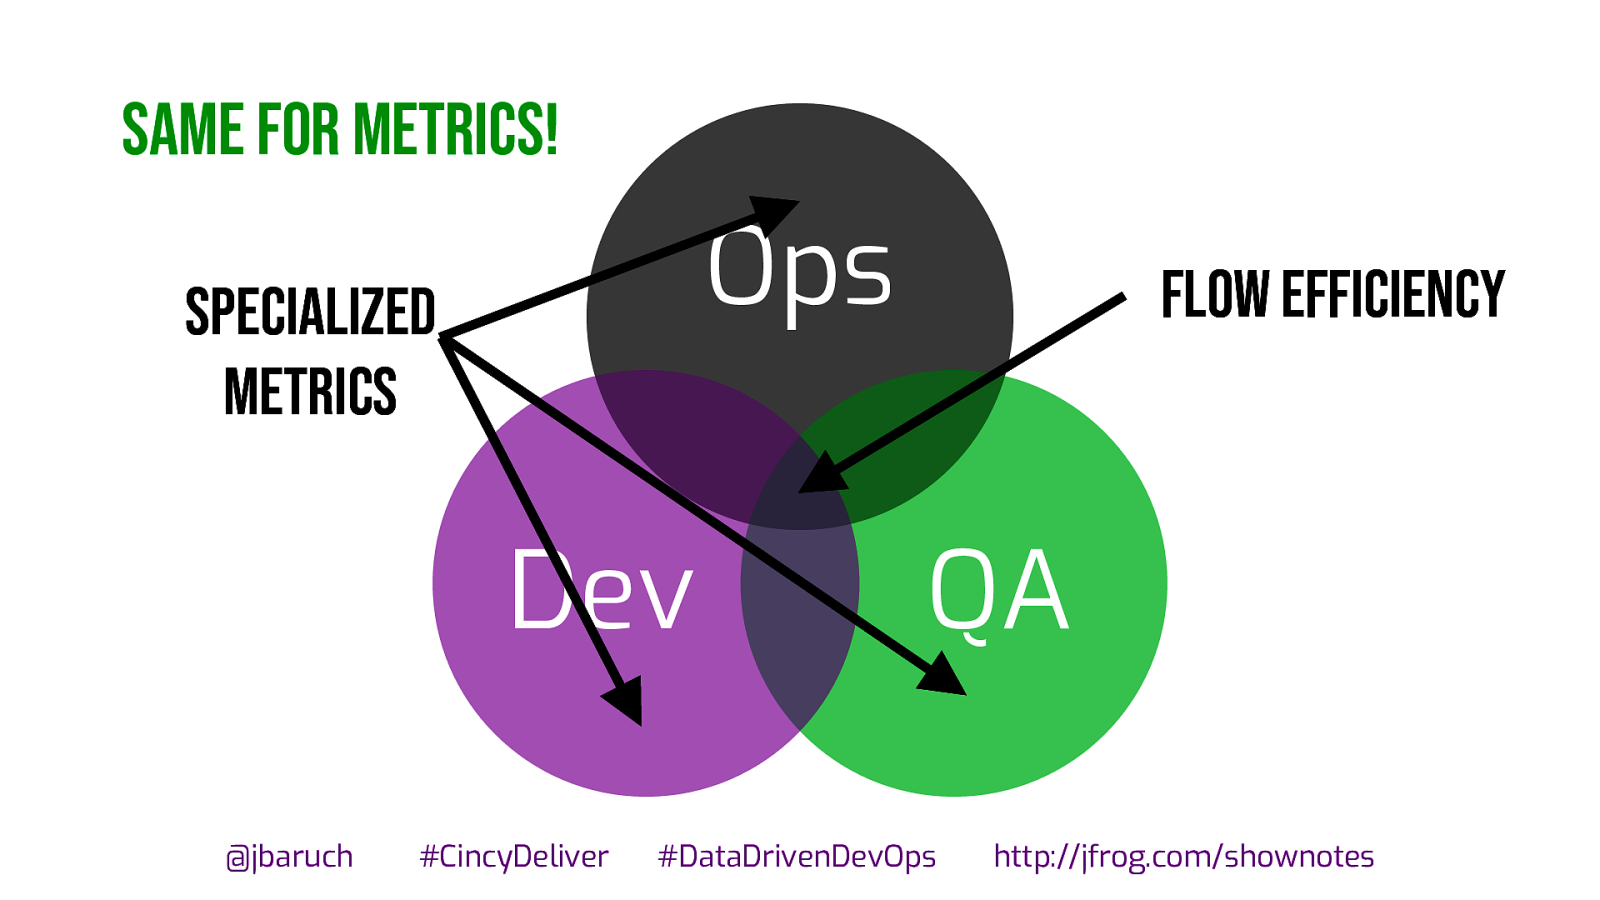
Same for metrics! Ops Specialized metrics Dev @jbaruch #CincyDeliver Flow Efficiency QA #DataDrivenDevOps http://jfrog.com/shownotes
Slide 29
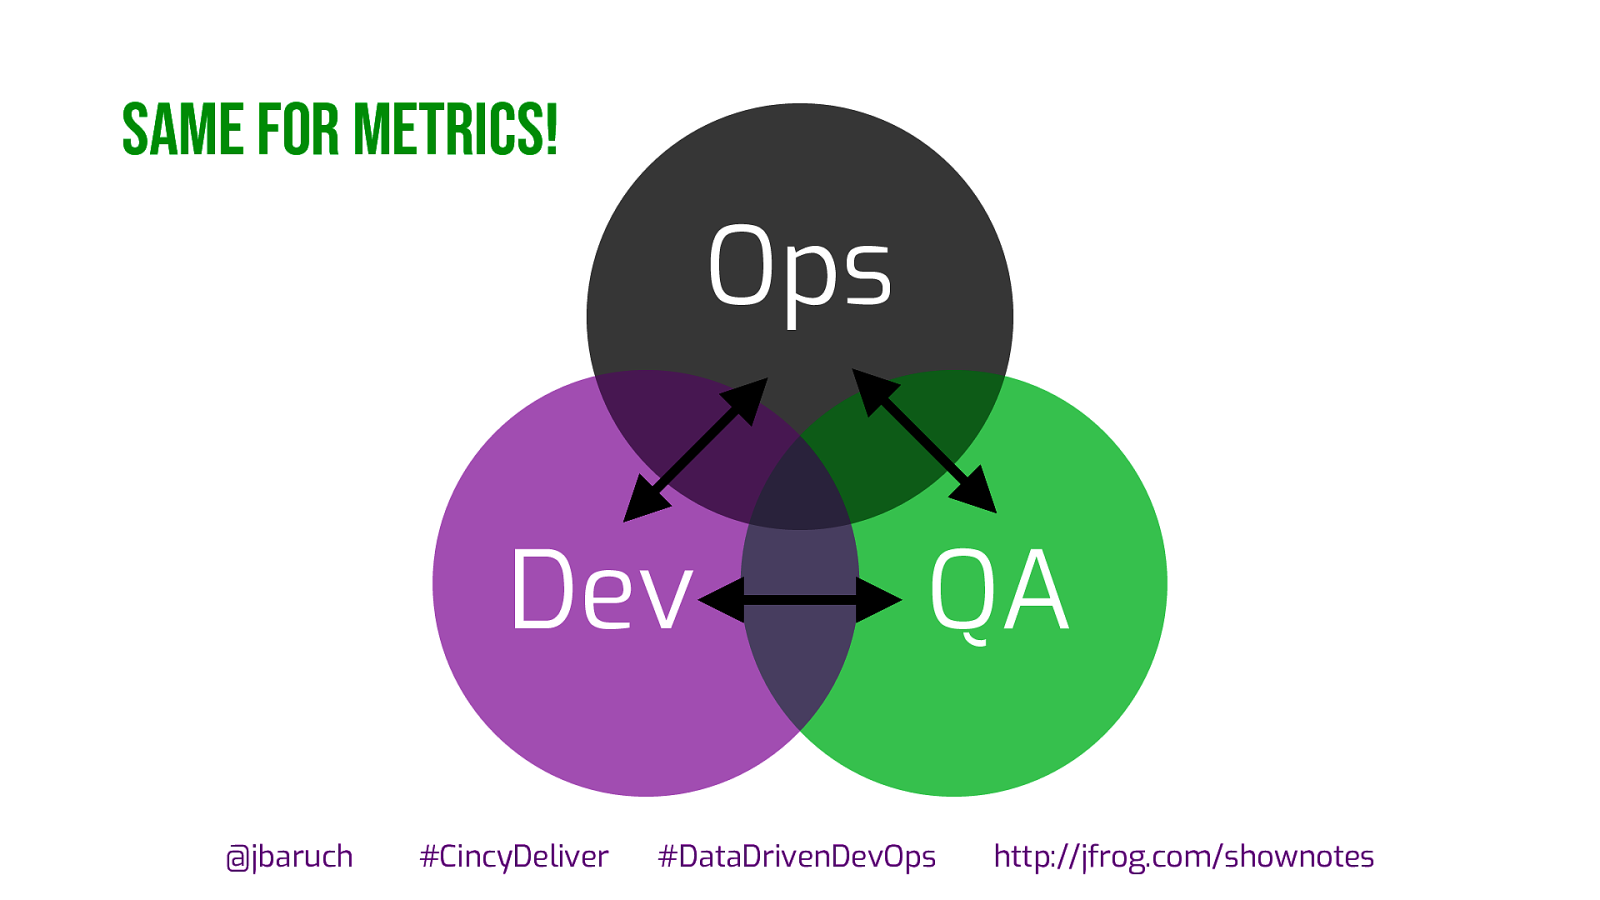
Same for metrics! Ops Dev @jbaruch #CincyDeliver QA #DataDrivenDevOps http://jfrog.com/shownotes
Slide 30
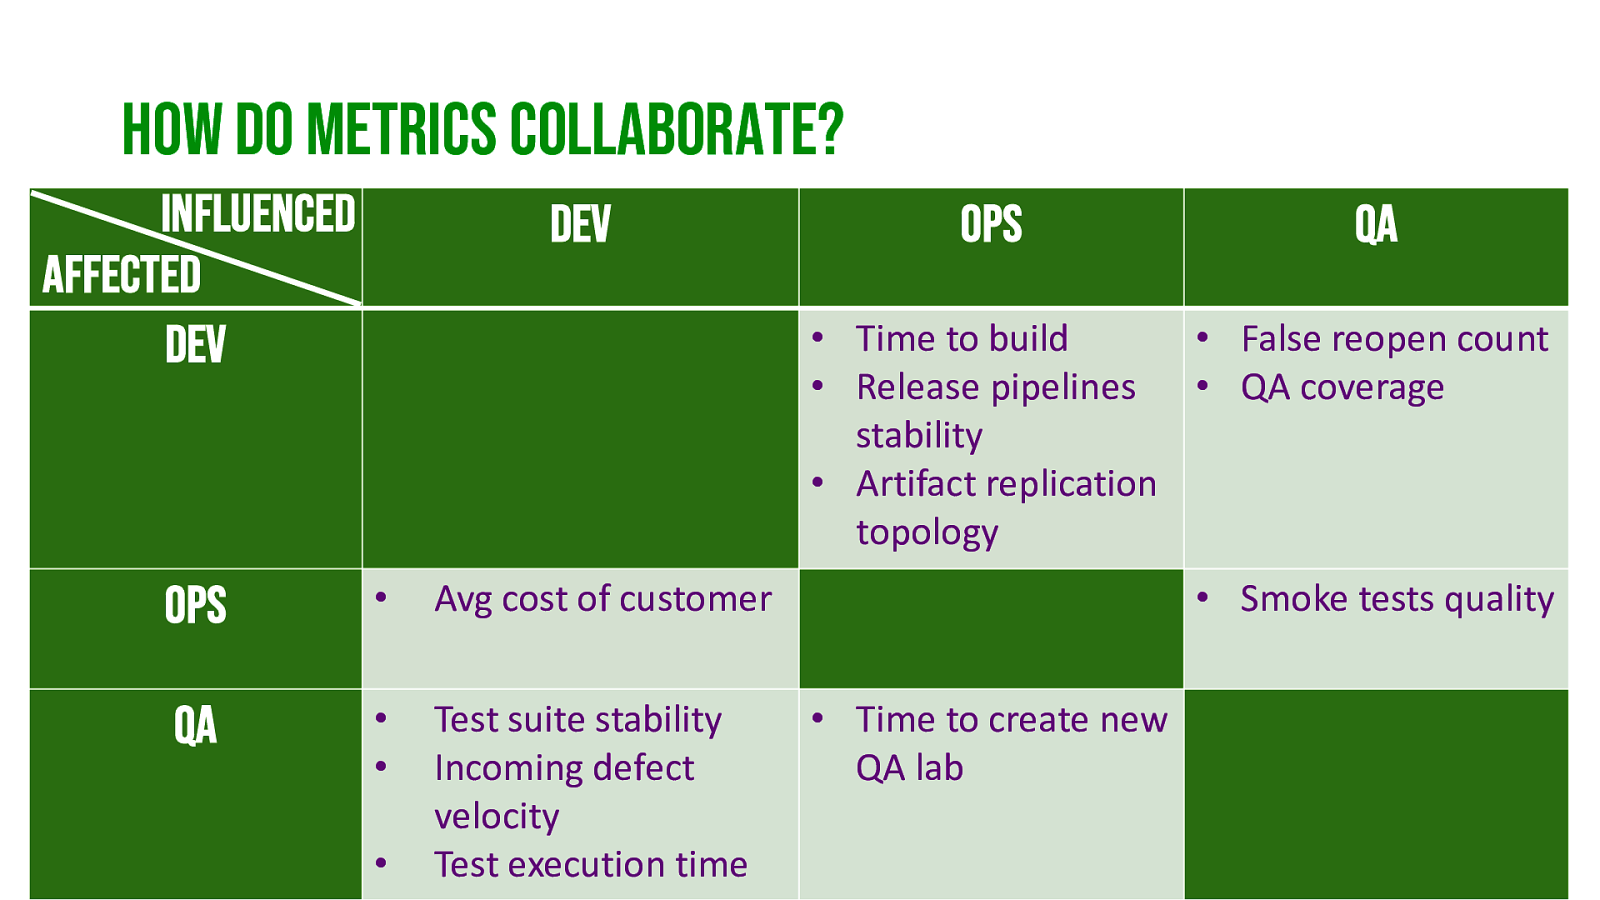
How do metrics collaborate? influenced affected dev dev qa • Time to build • False reopen count • Release pipelines • QA coverage stability • Artifact replication topology ops • qa • • @jbaruch ops Avg cost of customer • Smoke tests quality Test suite stability • Time to create new Incoming defect QA lab velocity http://jfrog.com/shownotes • #CincyDeliver Test execution#DataDrivenDevOps time
Slide 31
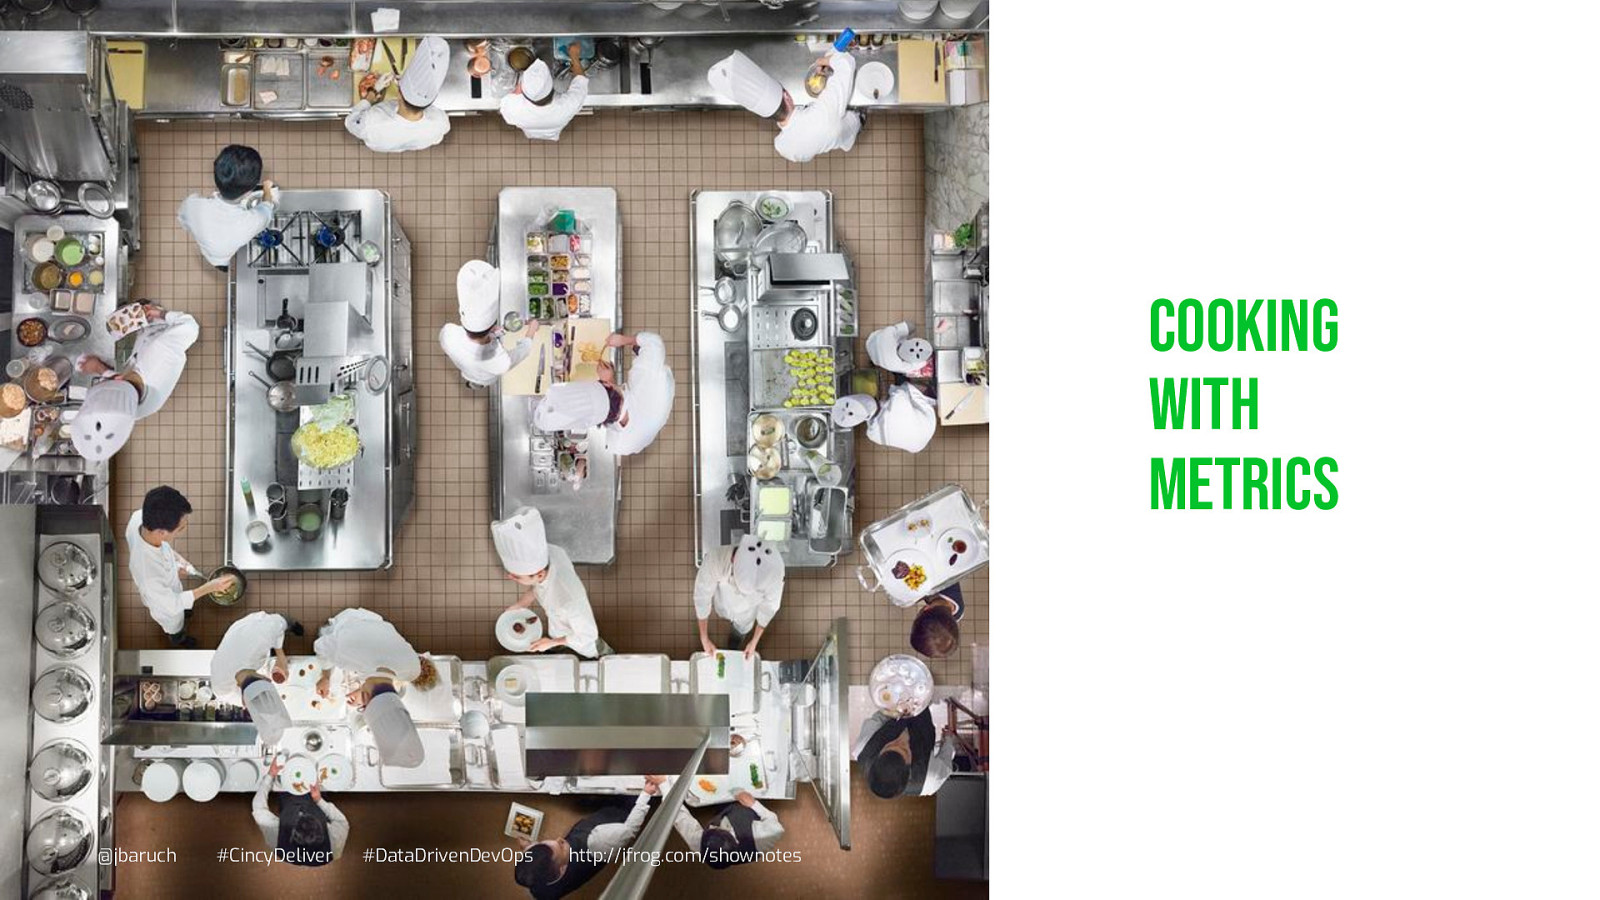
Cooking with metrics @jbaruch #CincyDeliver #DataDrivenDevOps http://jfrog.com/shownotes
Slide 32
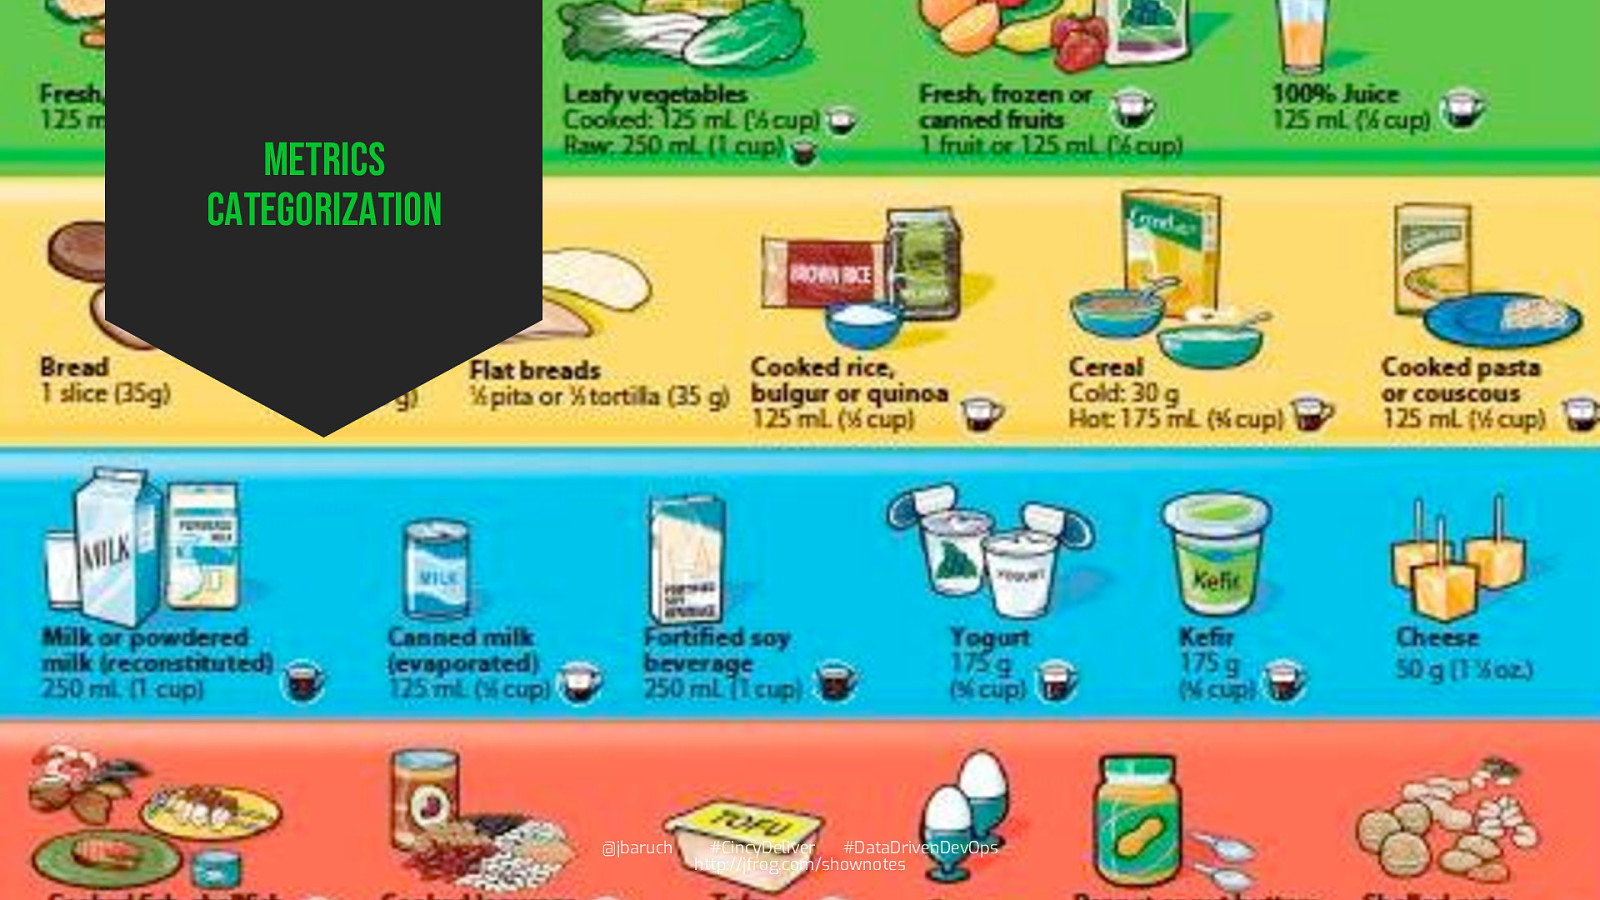
Metrics categorization @jbaruch #CincyDeliver #DataDrivenDevOps http://jfrog.com/shownotes
Slide 33
Why? @jbaruch #CincyDeliver #DataDrivenDevOps http://jfrog.com/shownotes
Slide 34

ROI – is this activity is the right thing to do?
Slide 35
Continuous improvement
Slide 36

trust
Slide 37
sampling @jbaruch #CincyDeliver #DataDrivenDevOps http://jfrog.com/shownotes
Slide 38

Complete sample
Slide 39
@jbaruch #CincyDeliver #DataDrivenDevOps http://jfrog.com/shownotes
Slide 40

Representative sample
Slide 41
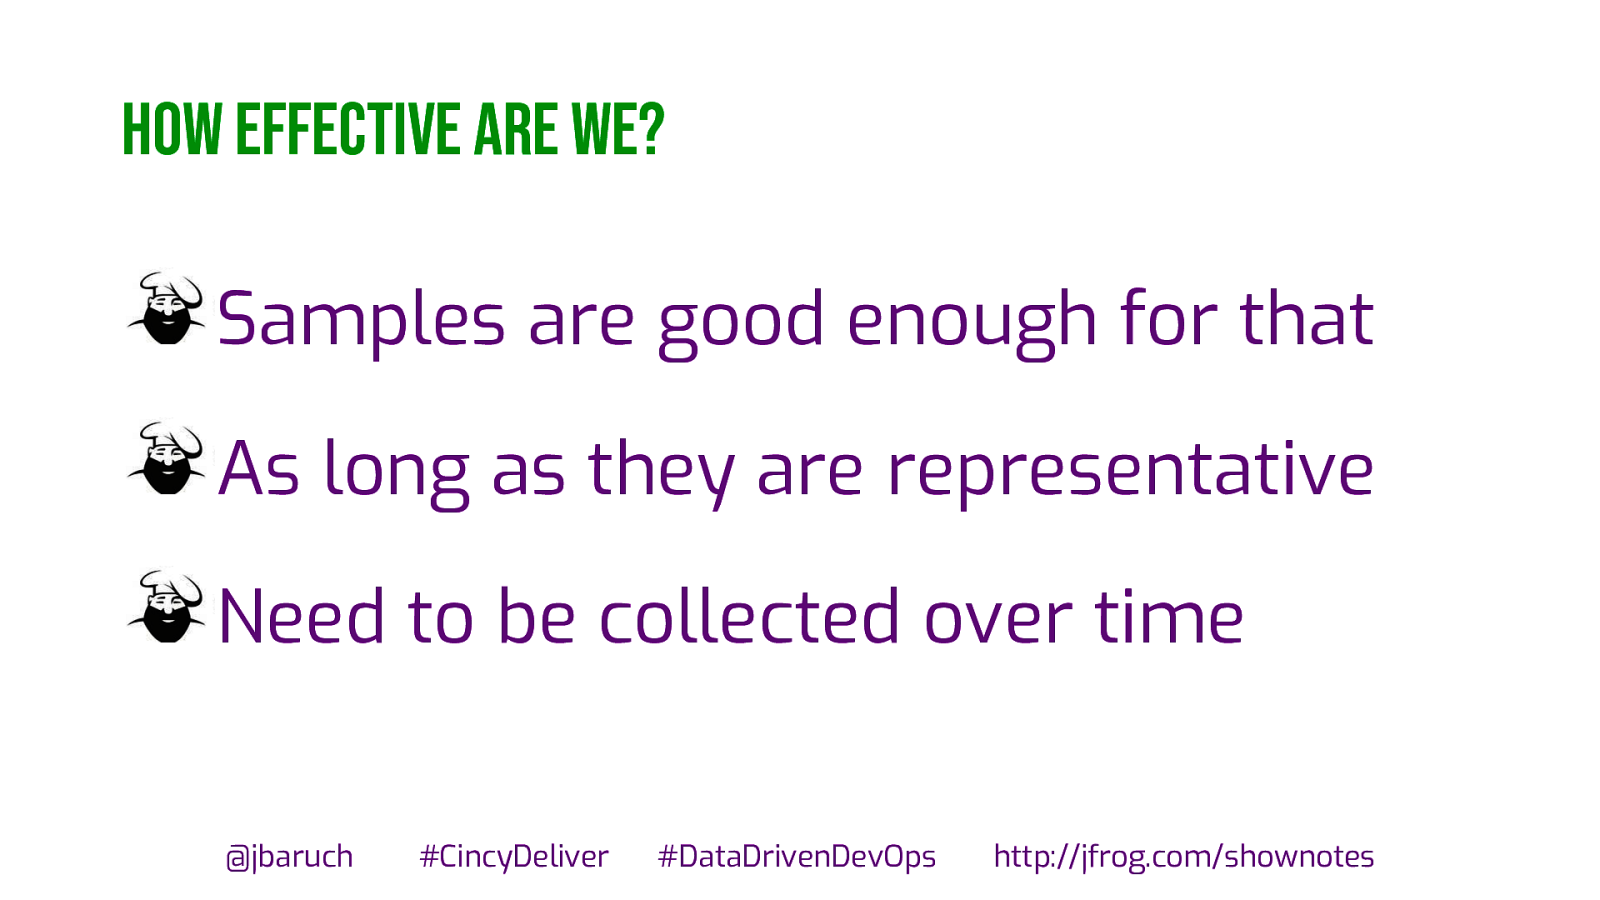
How effective are we? Samples are good enough for that As long as they are representative Need to be collected over time @jbaruch #CincyDeliver #DataDrivenDevOps http://jfrog.com/shownotes
Slide 42

Predicting the future
Slide 43
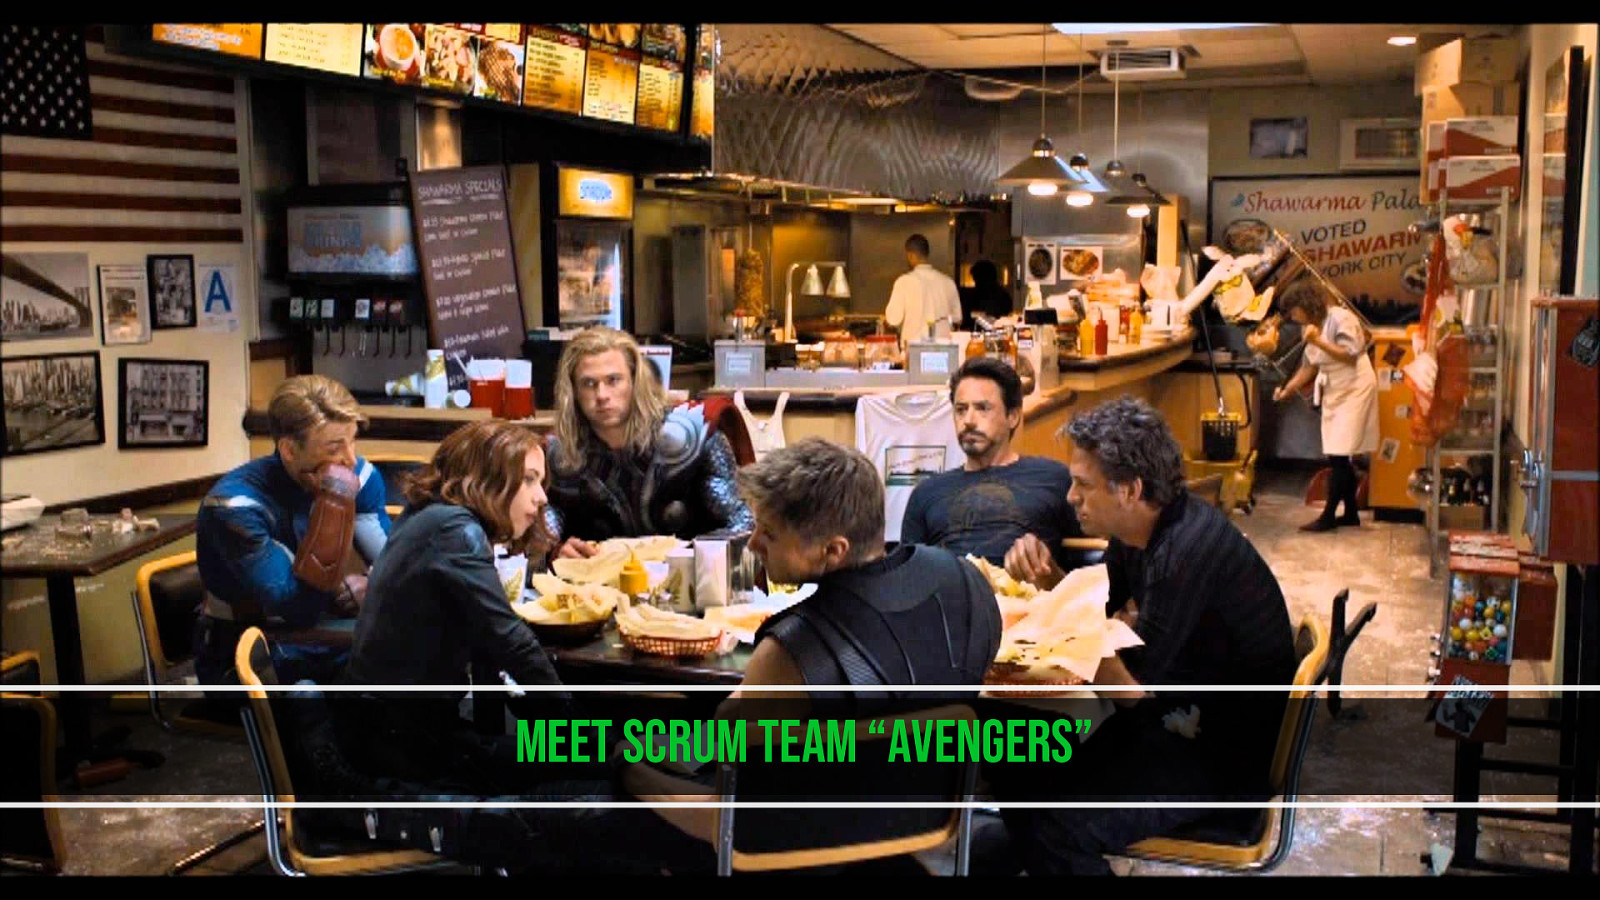
Meet scrum team “avengers”
Slide 44
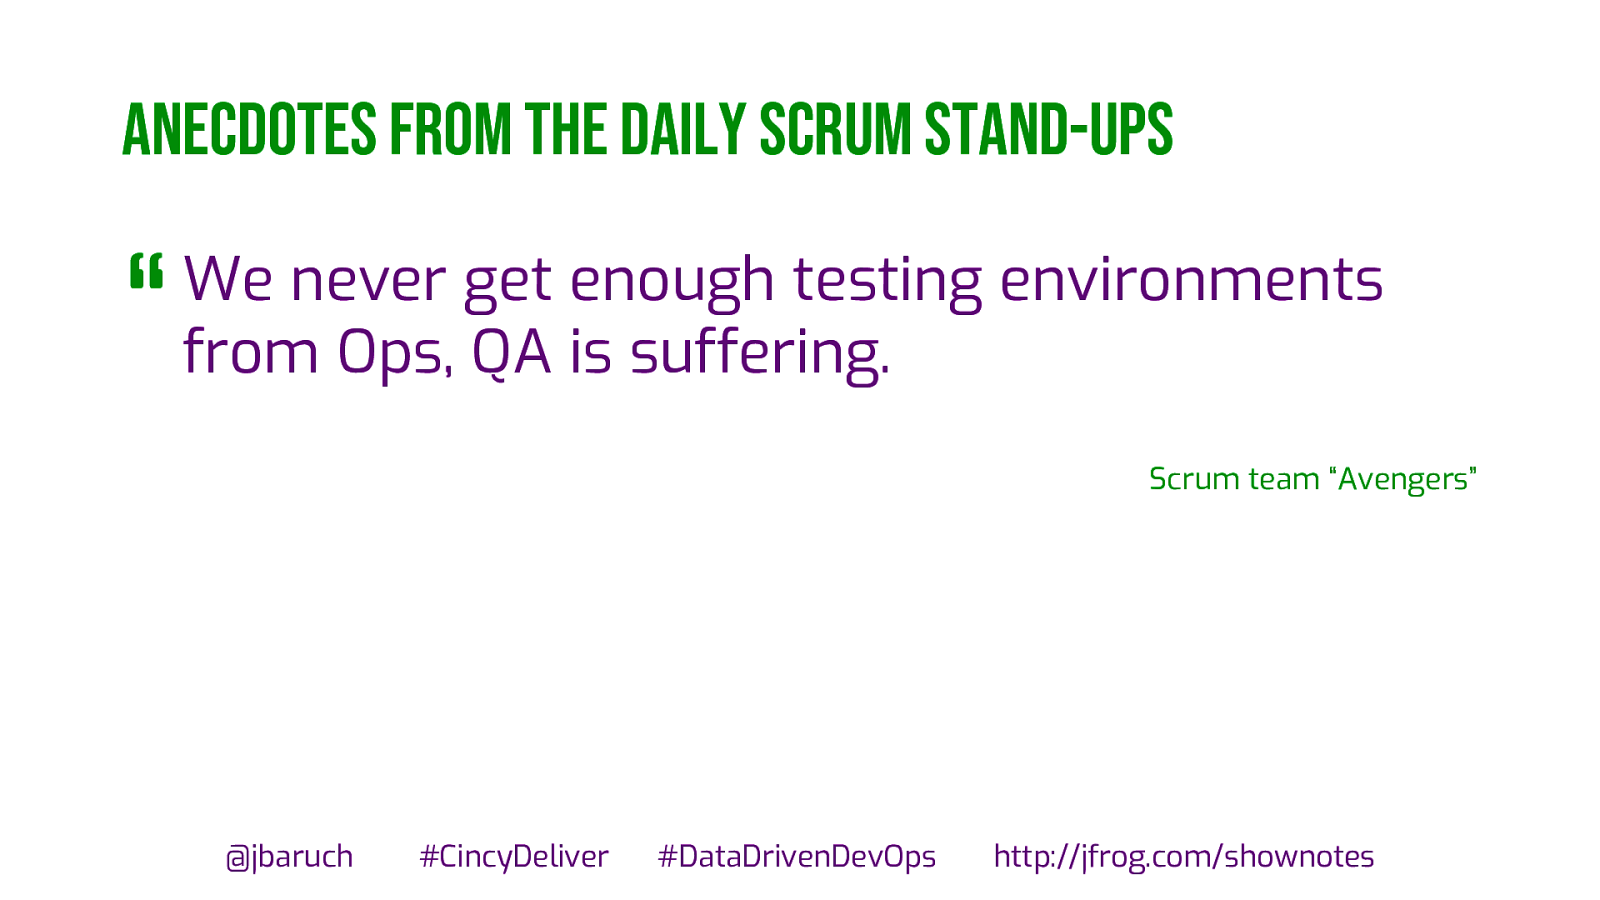
anecdotes from the daily scrum stand-ups “ We never get enough testing environments from Ops, QA is suffering. Scrum team “Avengers” @jbaruch #CincyDeliver #DataDrivenDevOps http://jfrog.com/shownotes
Slide 45
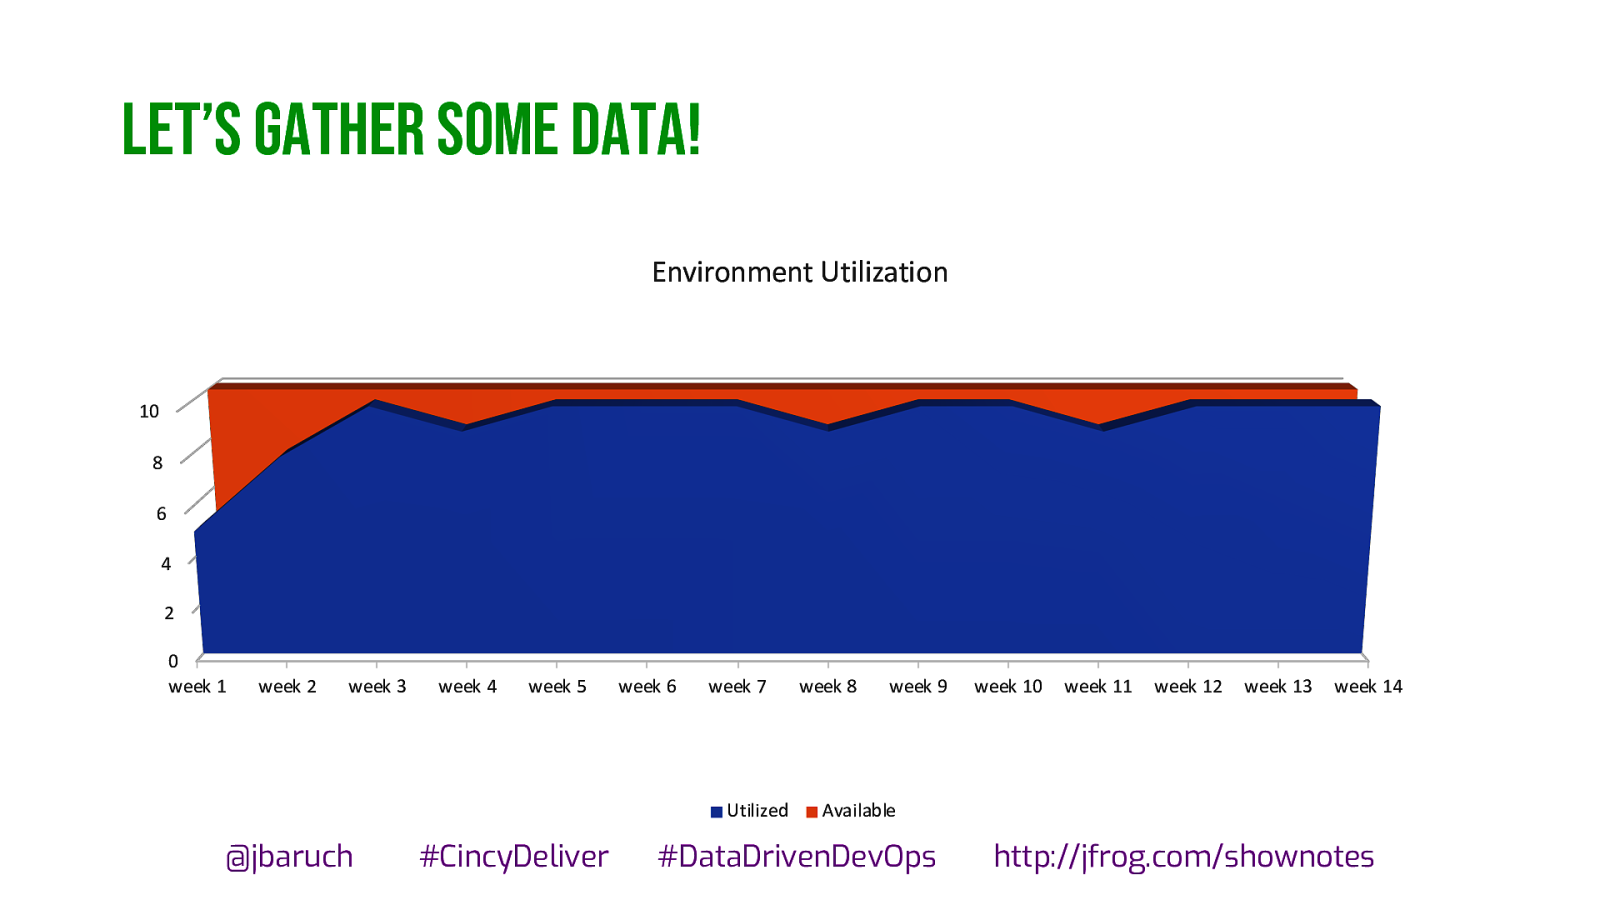
Let’s gather some data! Environment Utilization 10 8 6 4 2 0 week 1 week 2 week 3 week 4 week 5 week 6 week 7 Utilized @jbaruch #CincyDeliver week 8 week 9 week 10 week 11 week 12 week 13 week 14 Available #DataDrivenDevOps http://jfrog.com/shownotes
Slide 46
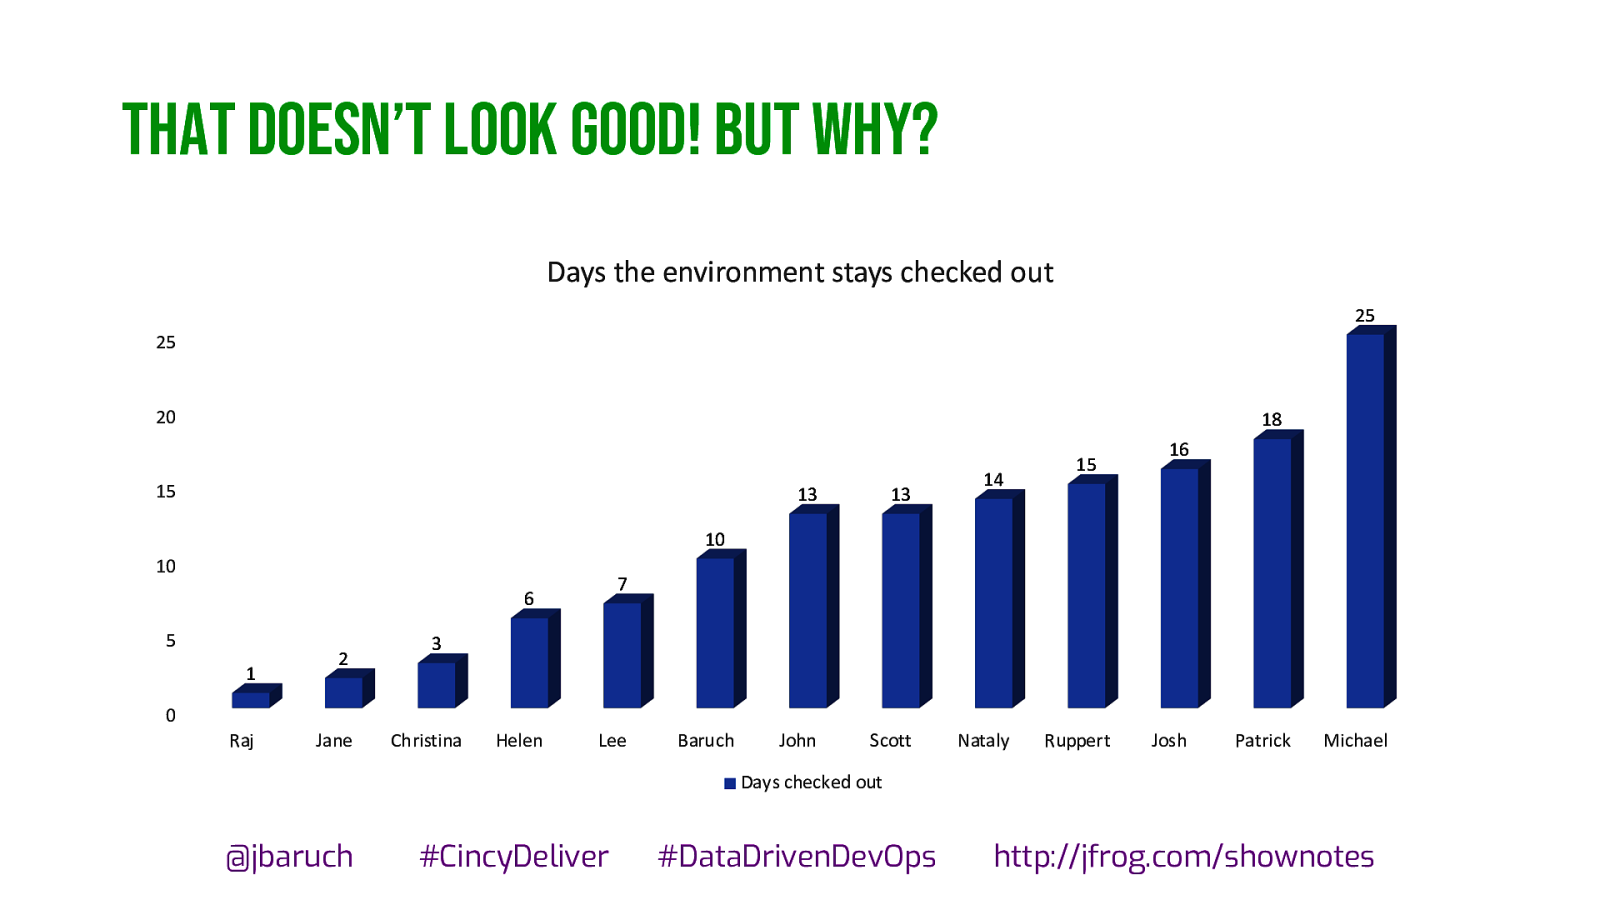
That doesn’t look good! But why? Days the environment stays checked out 25 25 20 18 15 13 13 John Scott 14 15 16 10 10 7 6 5 1 2 3 0 Raj Jane Christina Helen Lee Baruch Nataly Ruppert Josh Patrick Michael Days checked out @jbaruch #CincyDeliver #DataDrivenDevOps http://jfrog.com/shownotes
Slide 47
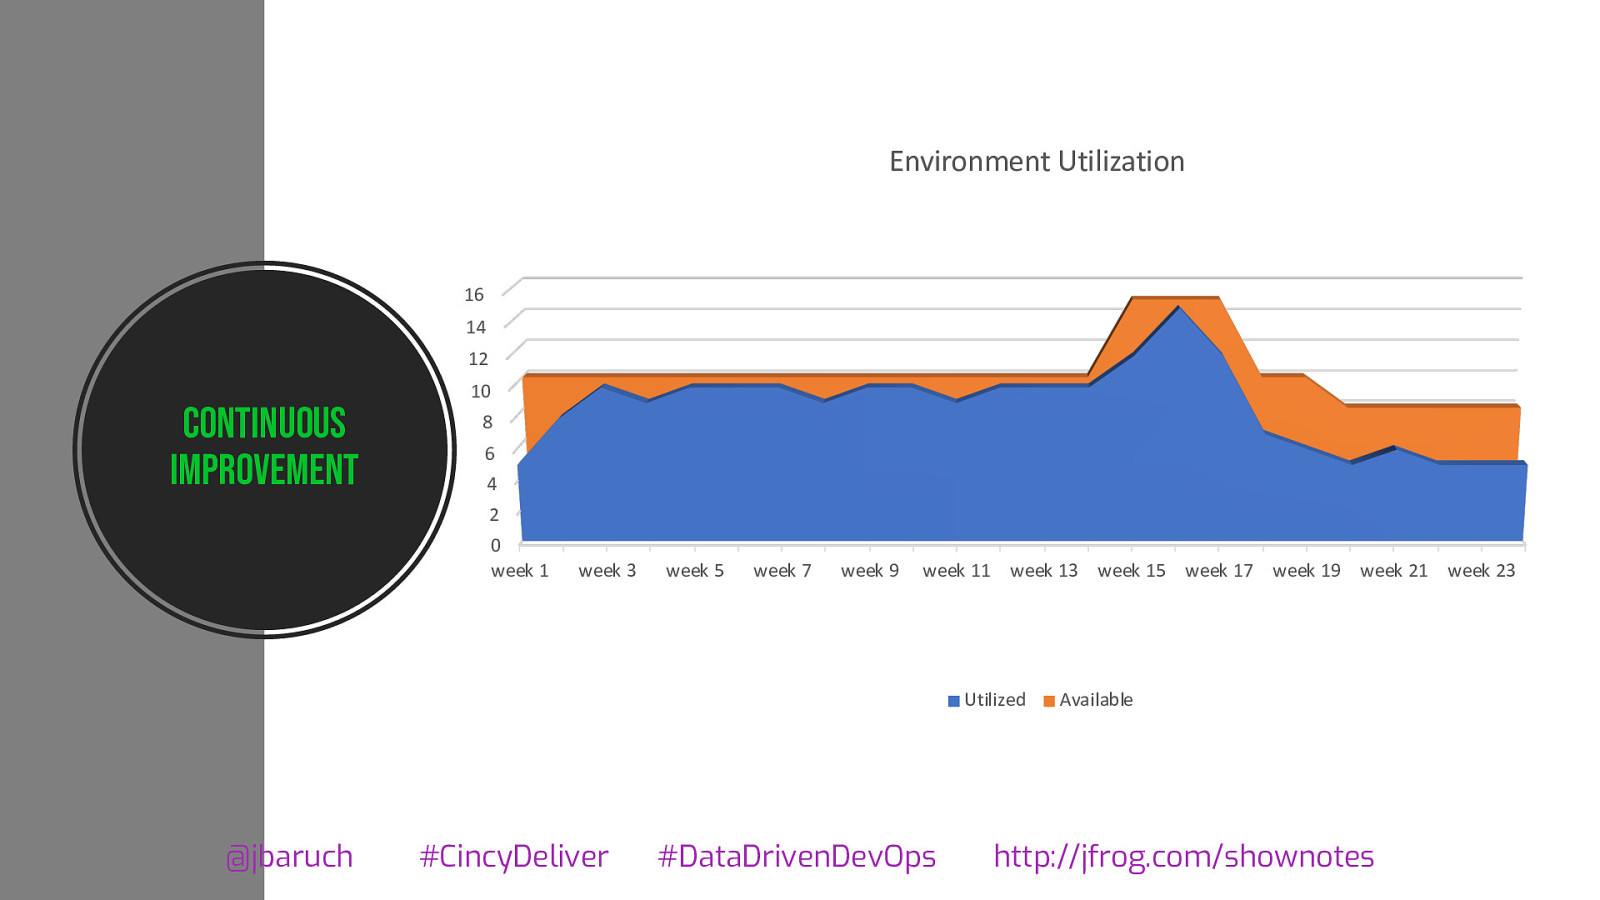
Environment Utilization 16 14 12 Continuous improvement 10 8 6 4 2 0 week 1 week 3 week 5 week 7 week 9 week 11 week 13 week 15 week 17 week 19 week 21 week 23 Utilized @jbaruch #CincyDeliver #DataDrivenDevOps Available http://jfrog.com/shownotes
Slide 48
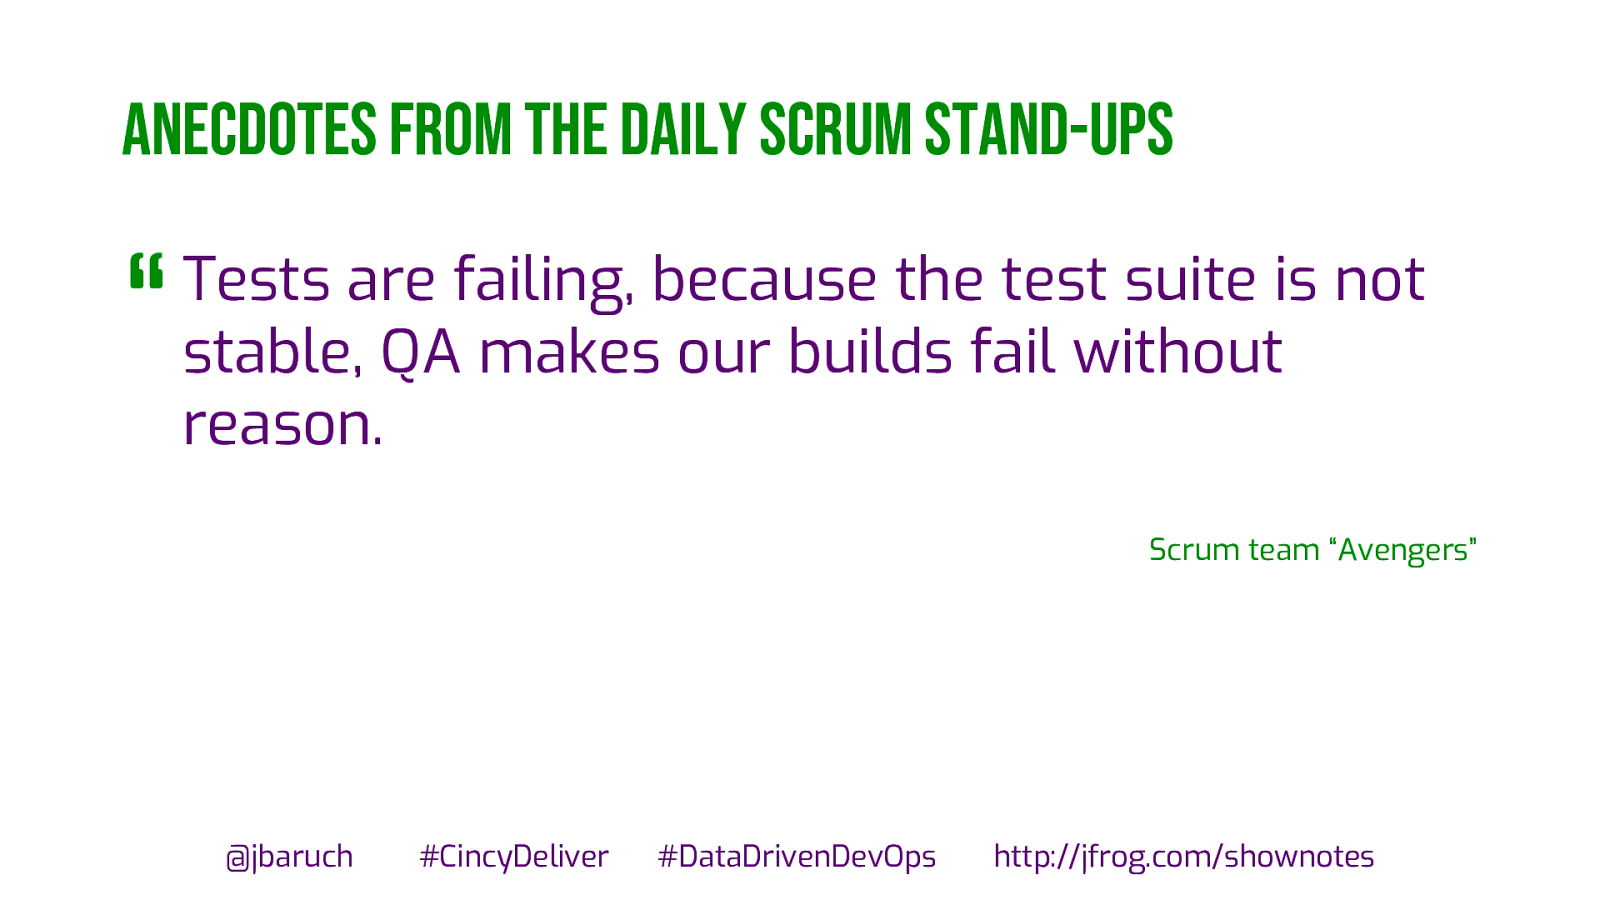
anecdotes from the daily scrum stand-ups “ Tests are failing, because the test suite is not stable, QA makes our builds fail without reason. Scrum team “Avengers” @jbaruch #CincyDeliver #DataDrivenDevOps http://jfrog.com/shownotes
Slide 49
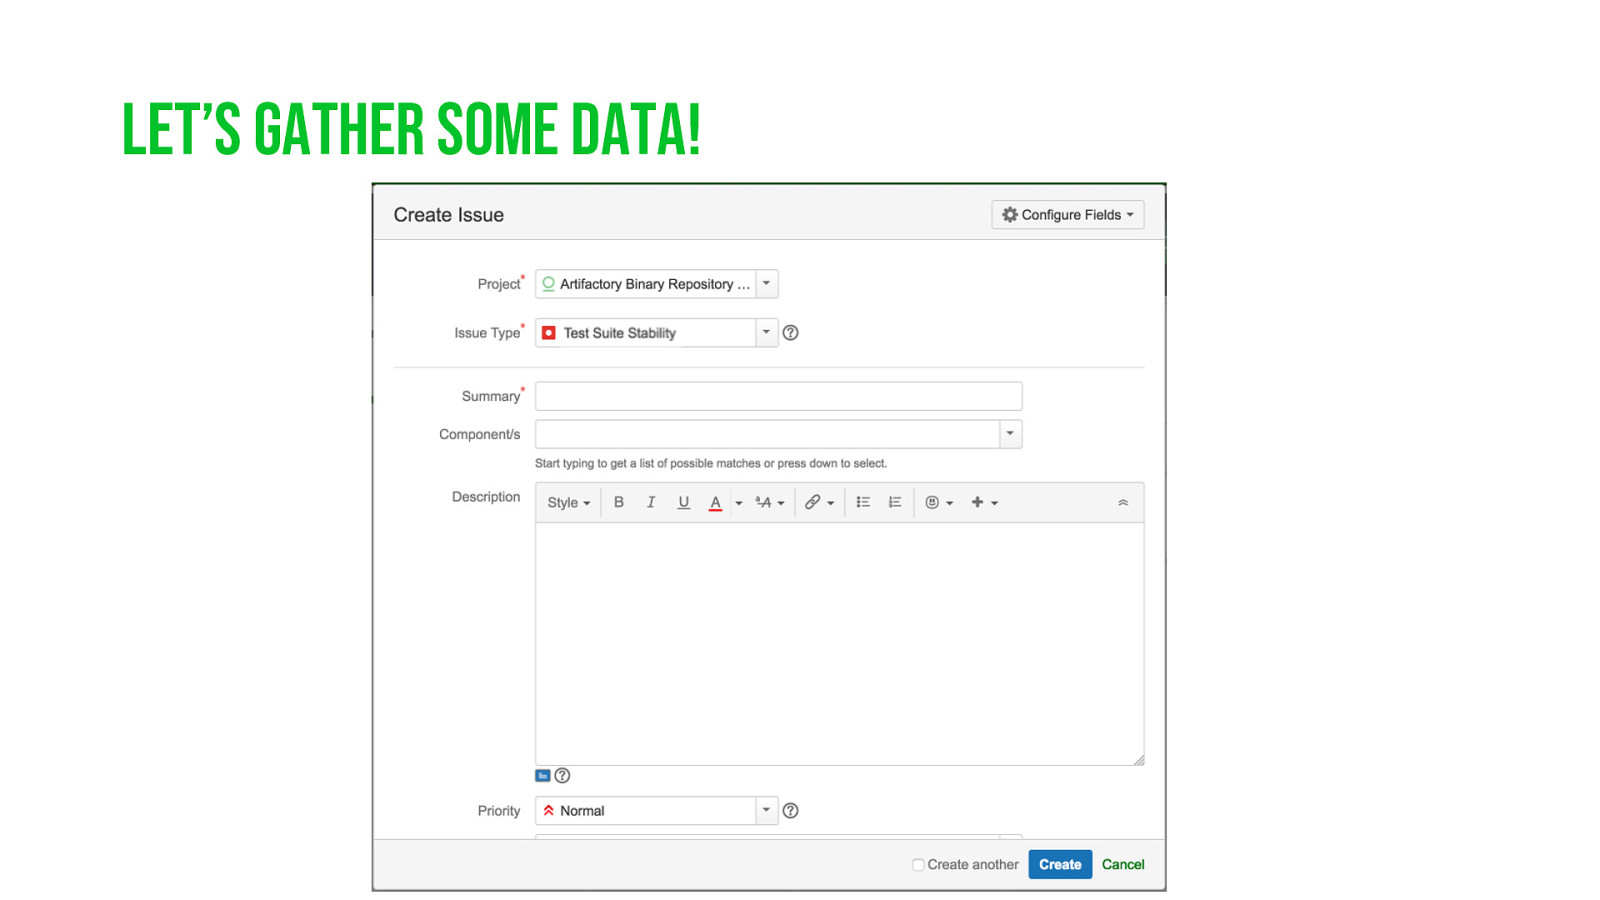
Let’s gather some data!
Slide 50
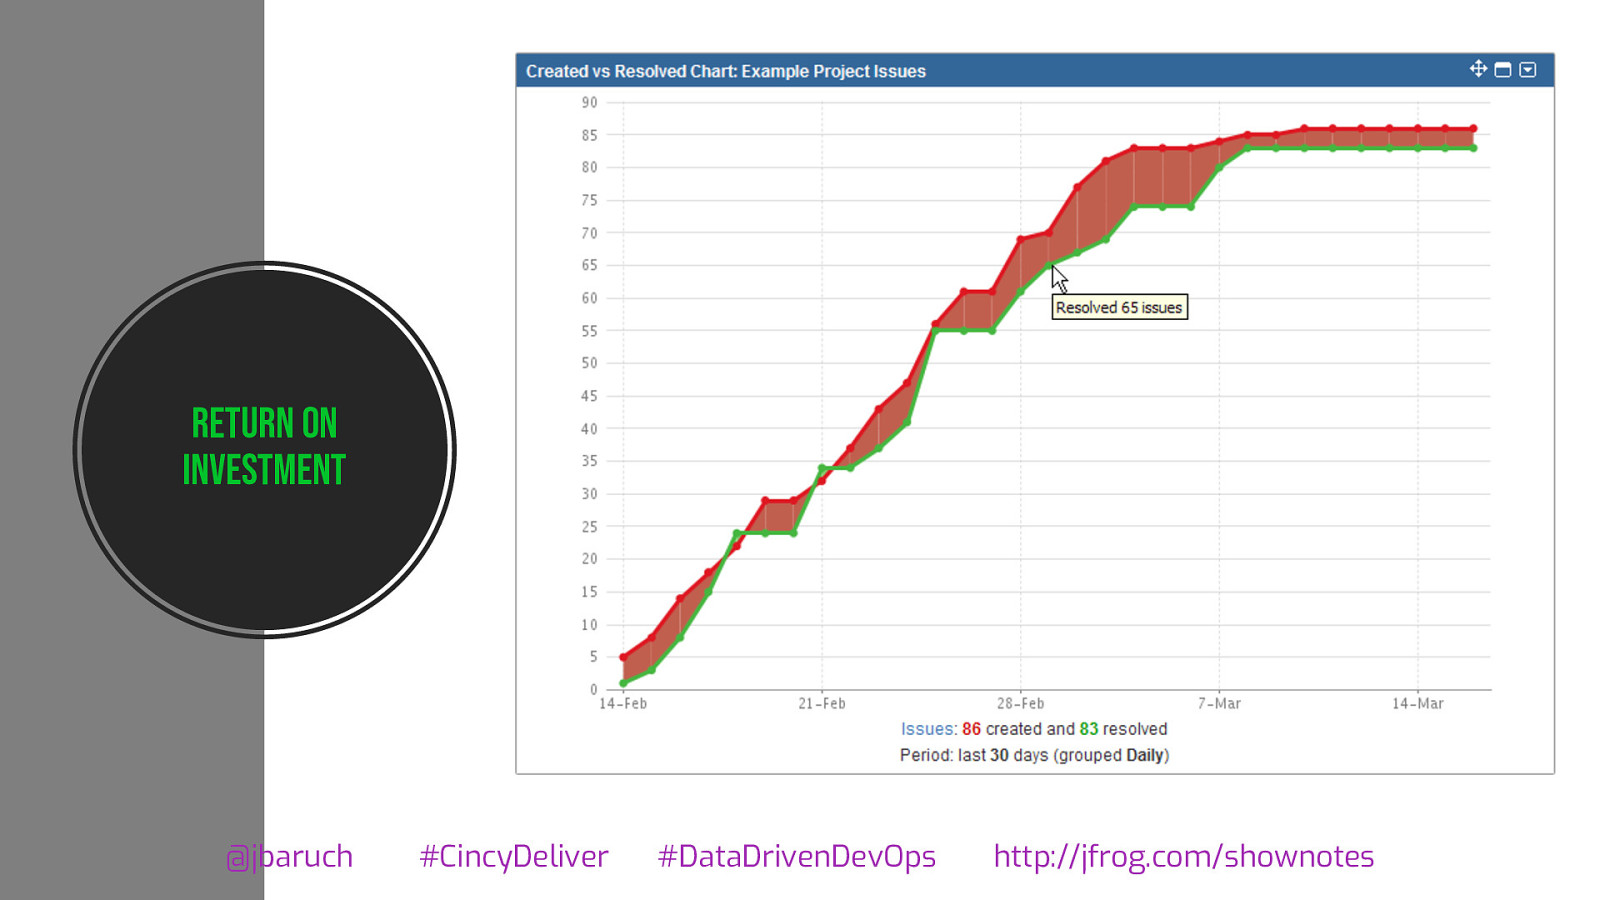
Return on investment @jbaruch #CincyDeliver #DataDrivenDevOps http://jfrog.com/shownotes
Slide 51
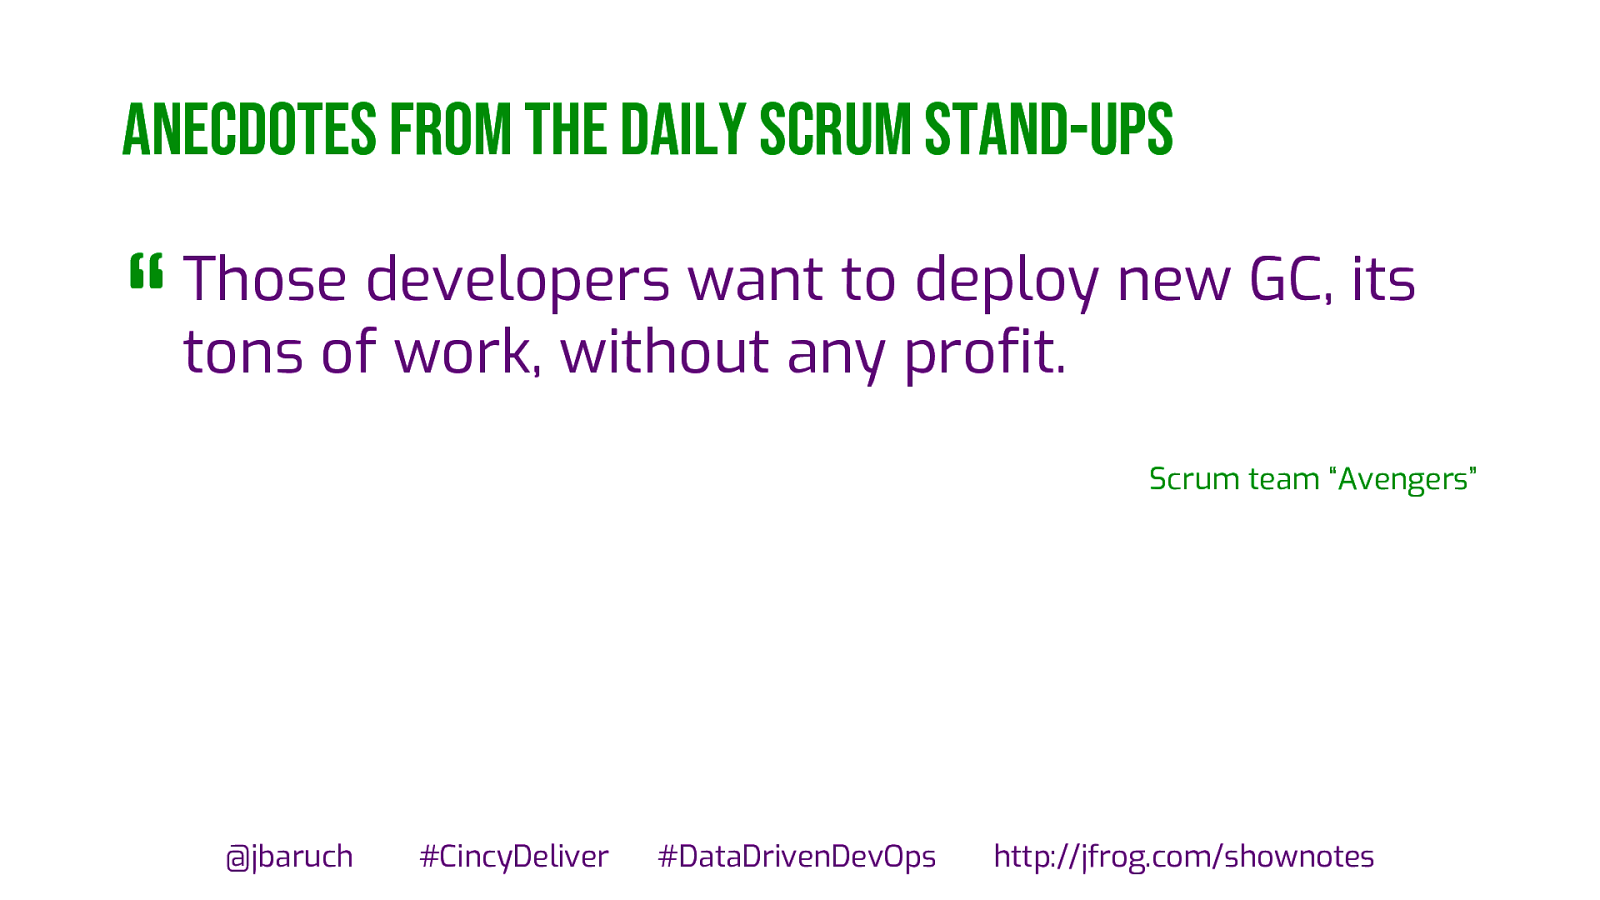
anecdotes from the daily scrum stand-ups “ Those developers want to deploy new GC, its tons of work, without any profit. Scrum team “Avengers” @jbaruch #CincyDeliver #DataDrivenDevOps http://jfrog.com/shownotes
Slide 52
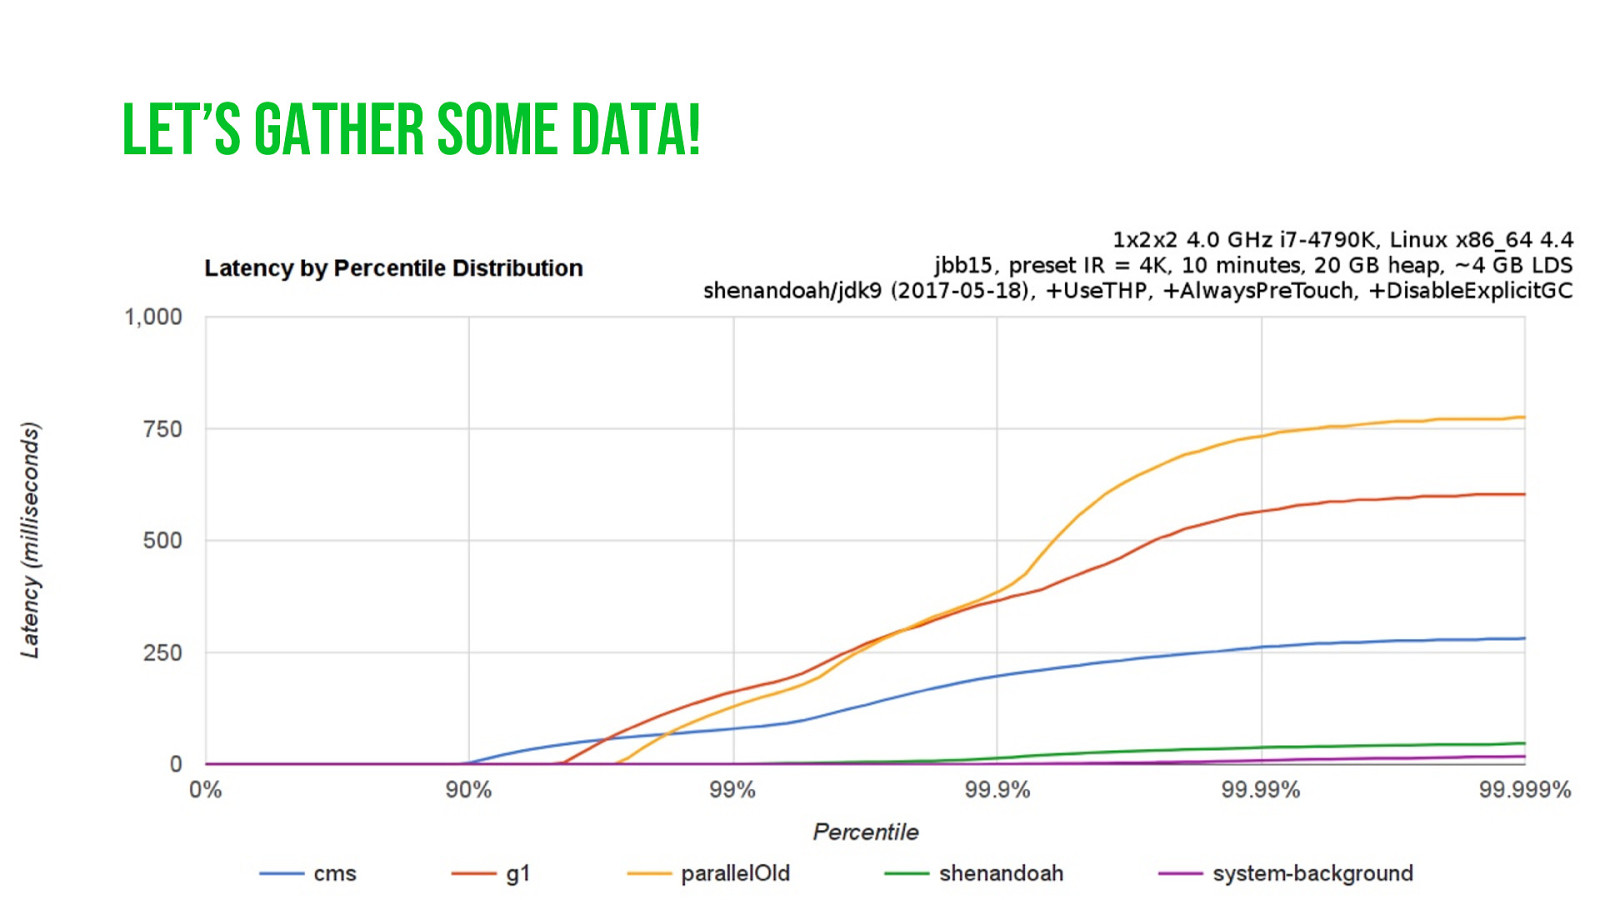
Let’s gather some data! @jbaruch #CincyDeliver #DataDrivenDevOps http://jfrog.com/shownotes
Slide 53
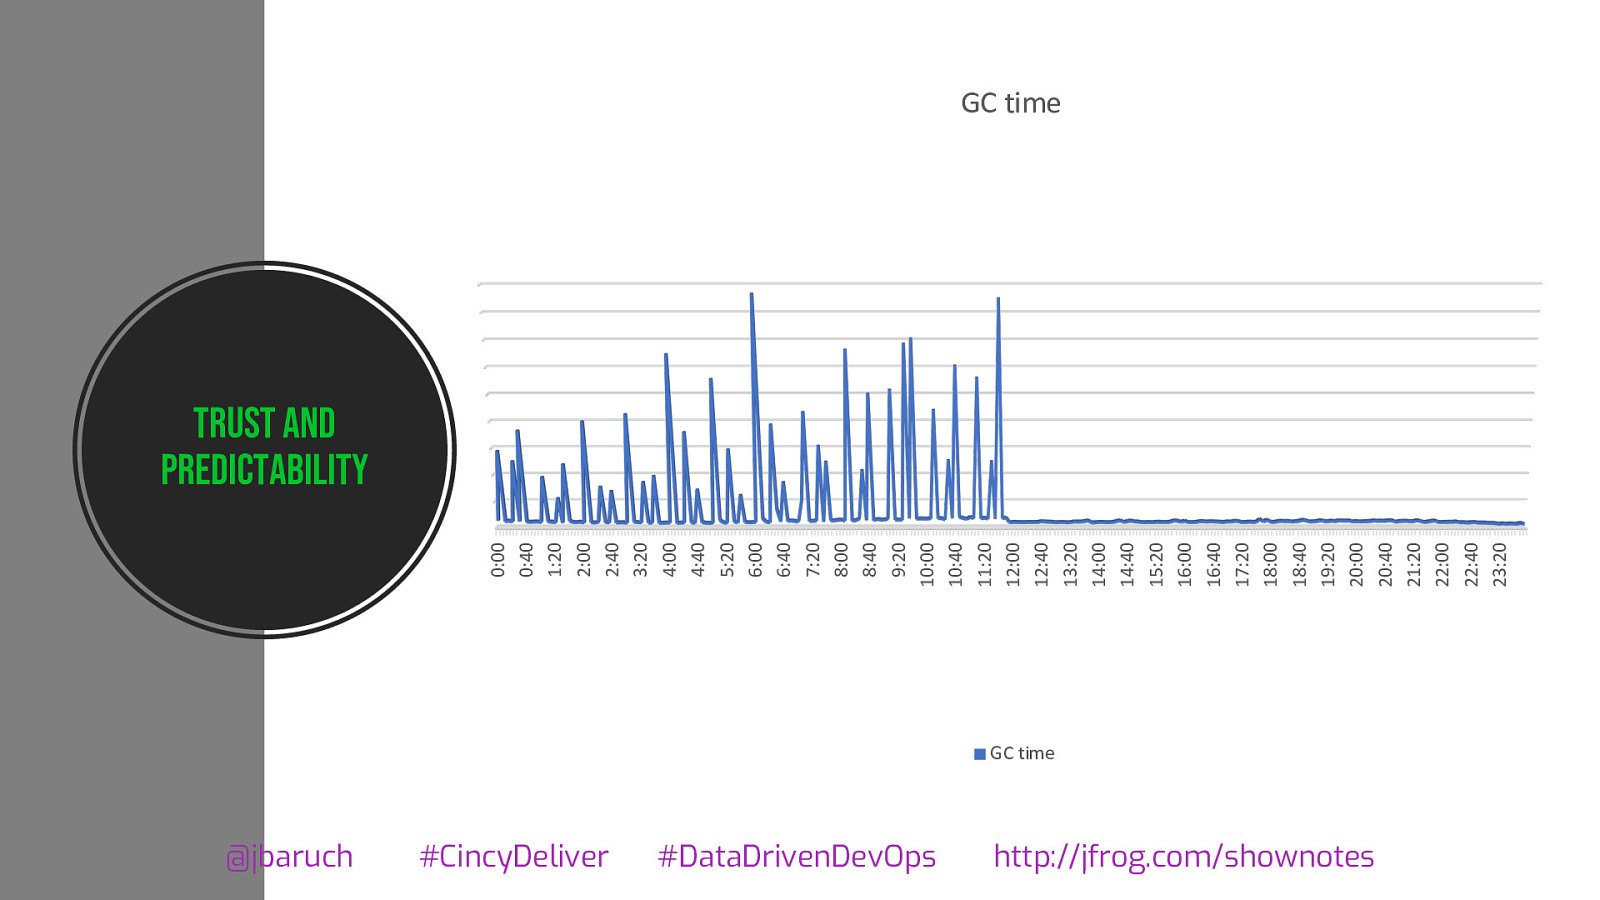
0:00 0:40 1:20 2:00 2:40 3:20 4:00 4:40 5:20 6:00 6:40 7:20 8:00 8:40 9:20 10:00 10:40 11:20 12:00 12:40 13:20 14:00 14:40 15:20 16:00 16:40 17:20 18:00 18:40 19:20 20:00 20:40 21:20 22:00 22:40 23:20 GC time Trust and predictability GC time @jbaruch #CincyDeliver #DataDrivenDevOps http://jfrog.com/shownotes
Slide 54

Dos and Don’ts
Slide 55

Measuring the right thing
Slide 56
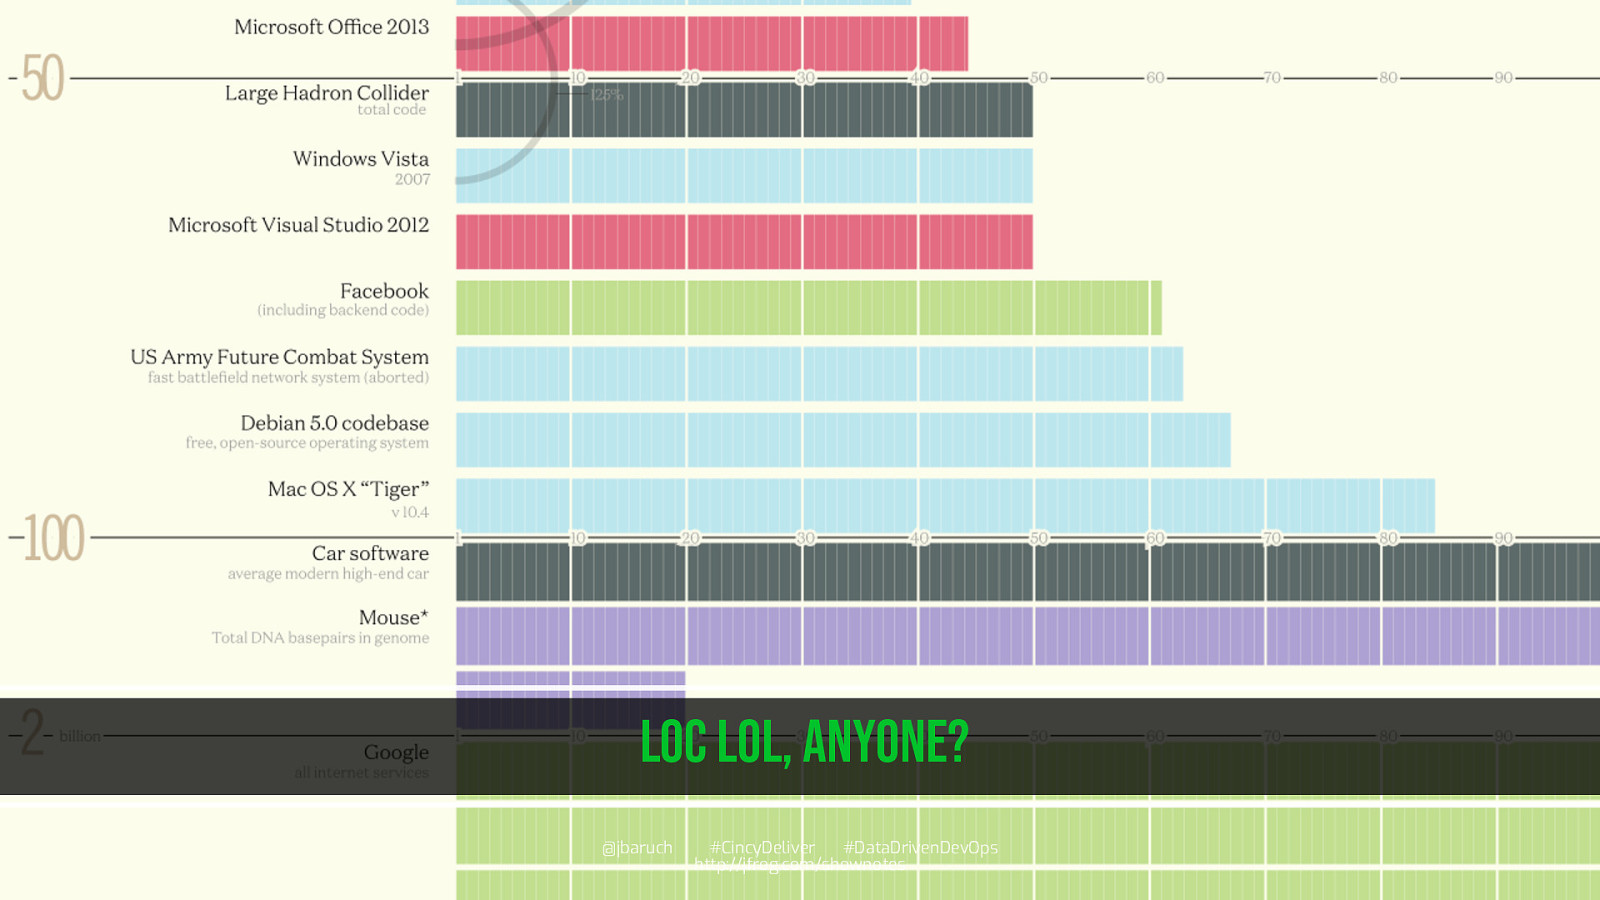
LoC LOL, anyone? @jbaruch #CincyDeliver #DataDrivenDevOps http://jfrog.com/shownotes
Slide 57
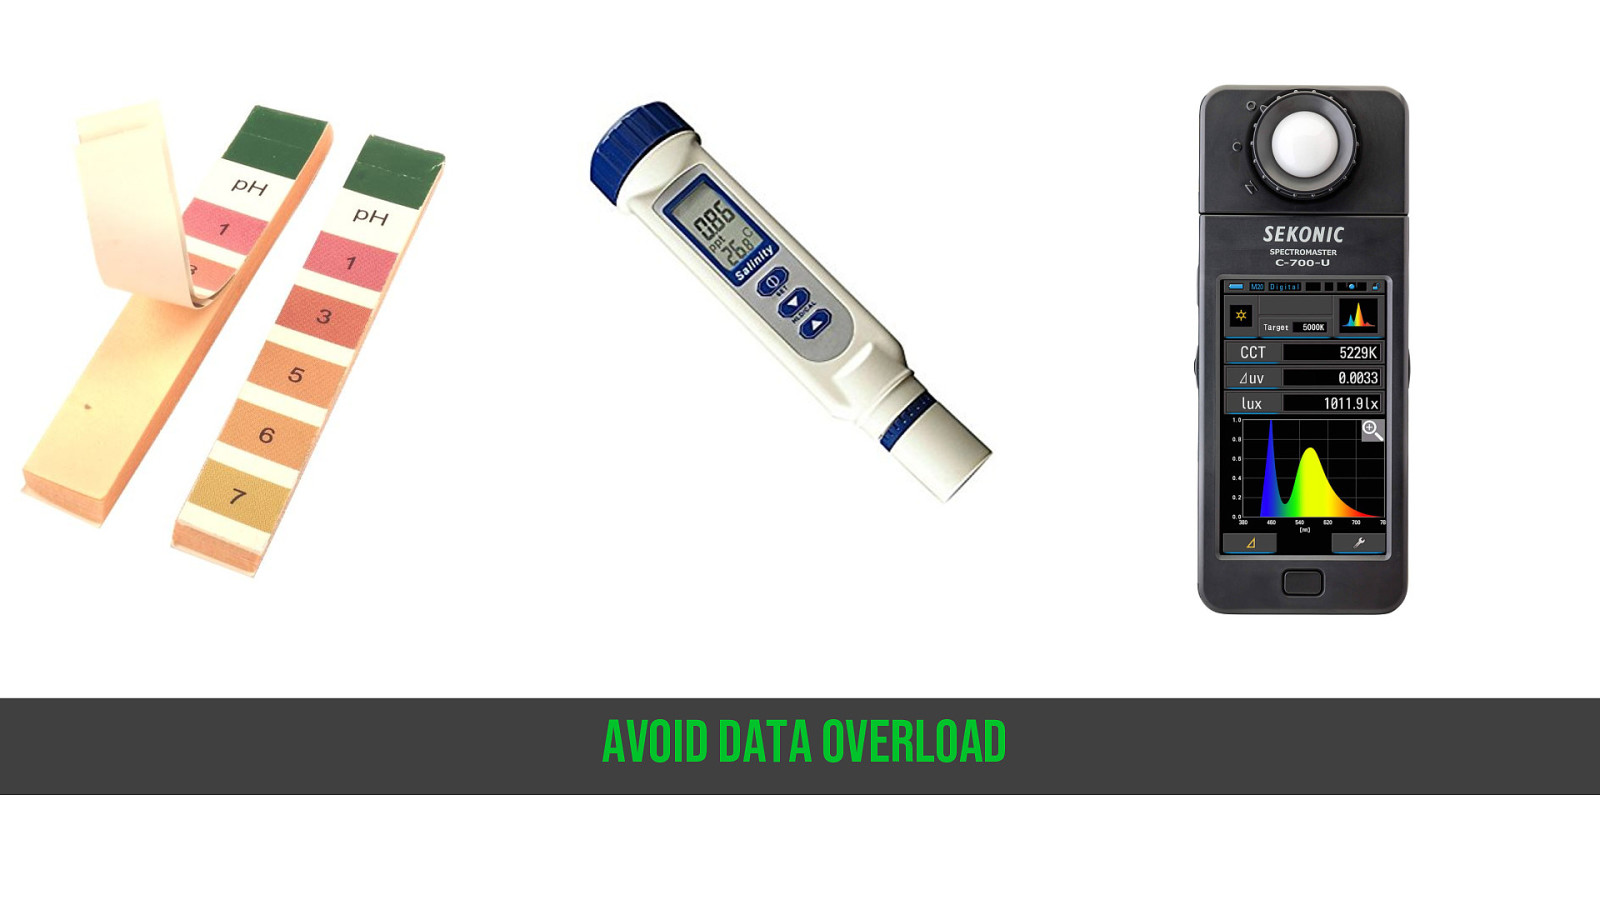
Avoid data overload
Slide 58
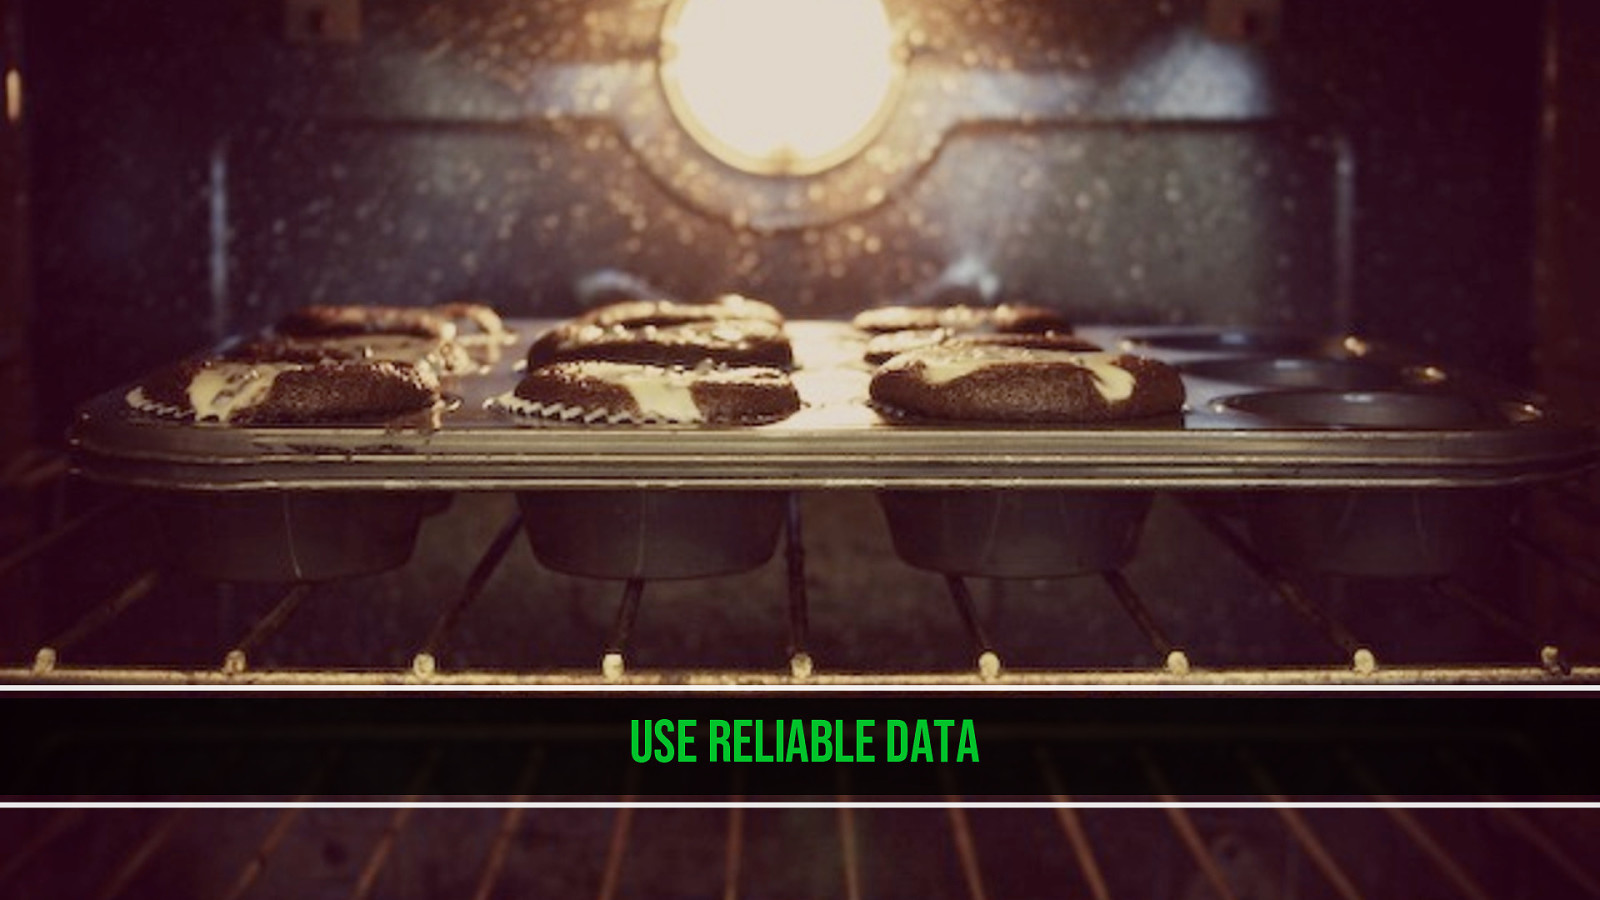
Use reliable data
Slide 59
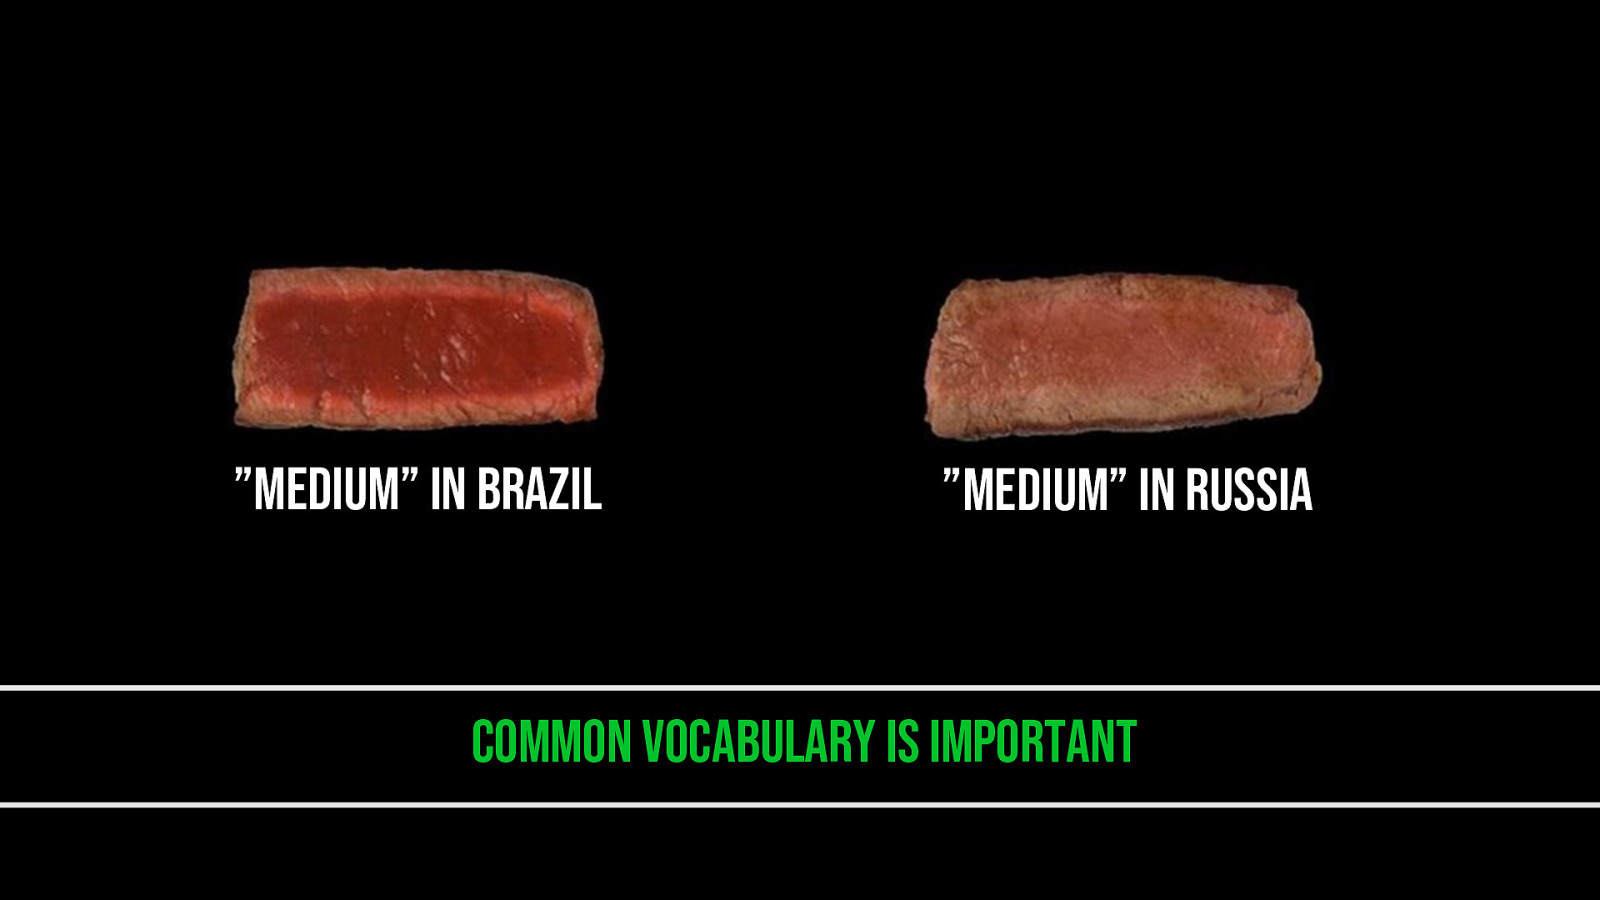
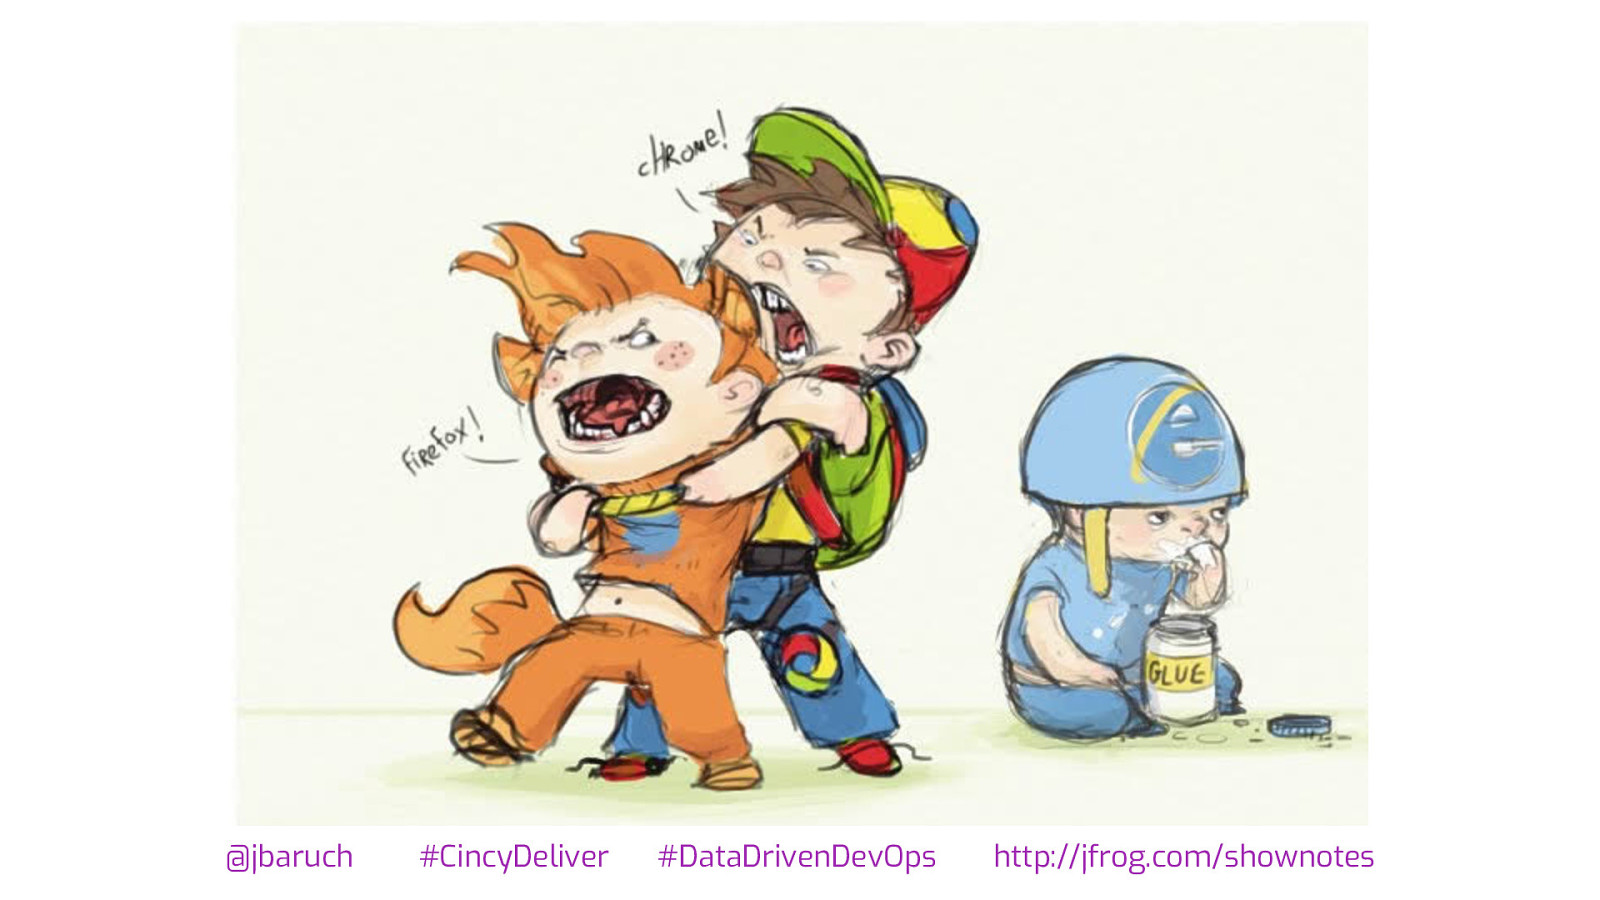
”medium” In brazil ”medium” In russia Common vocabulary is important
Slide 60
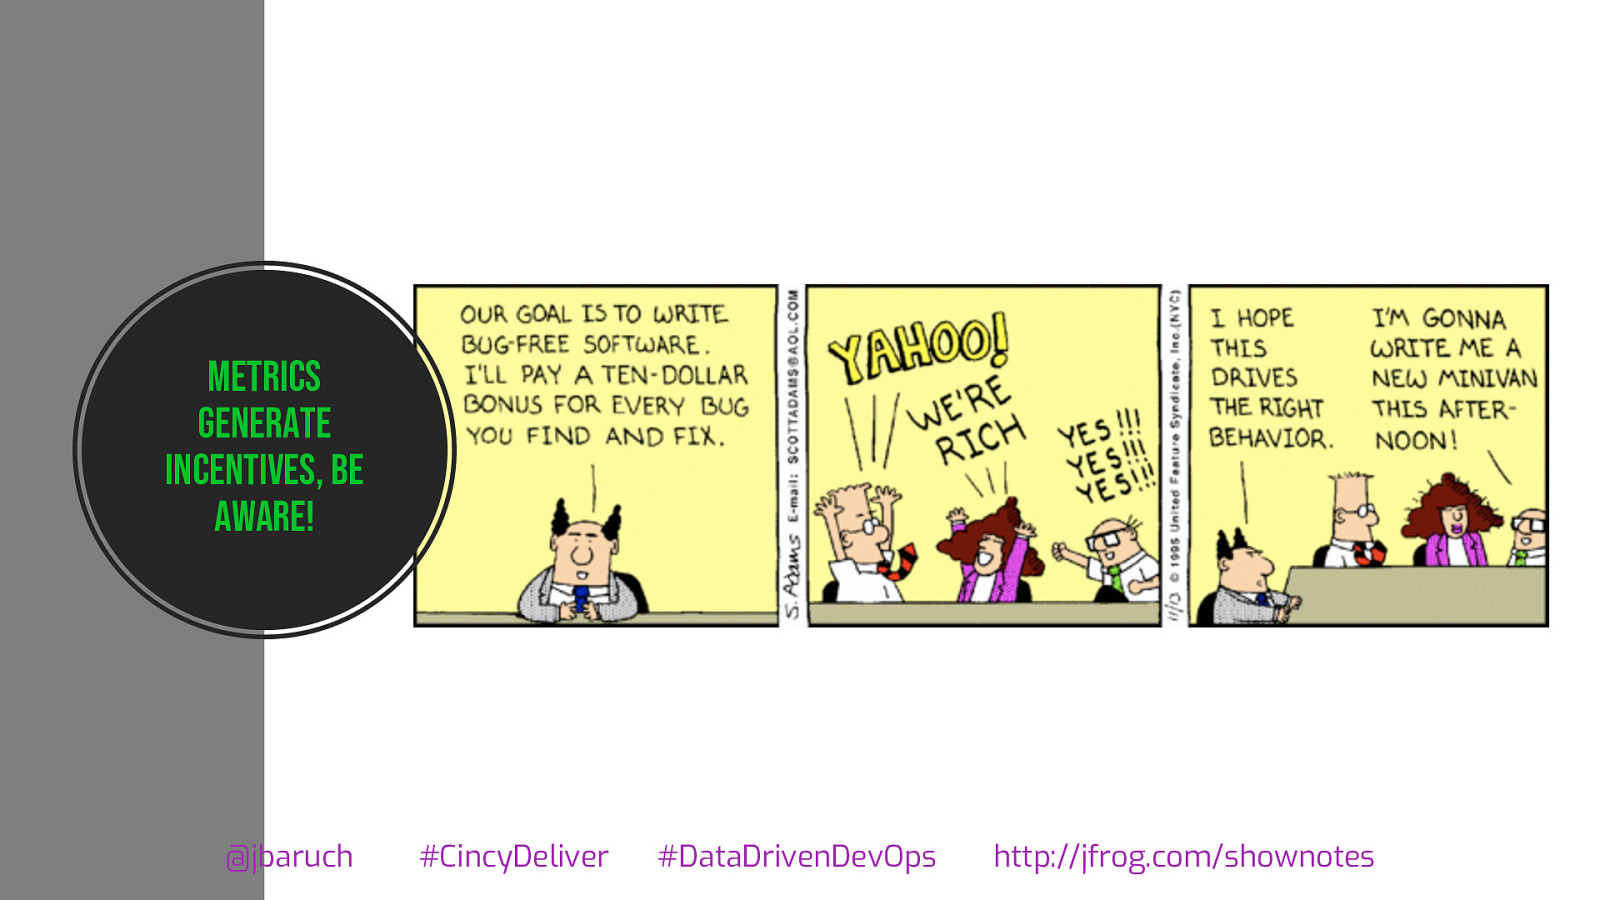
Metrics generate incentives, be aware! @jbaruch #CincyDeliver #DataDrivenDevOps http://jfrog.com/shownotes
Slide 61

Tweak as you go
Slide 62
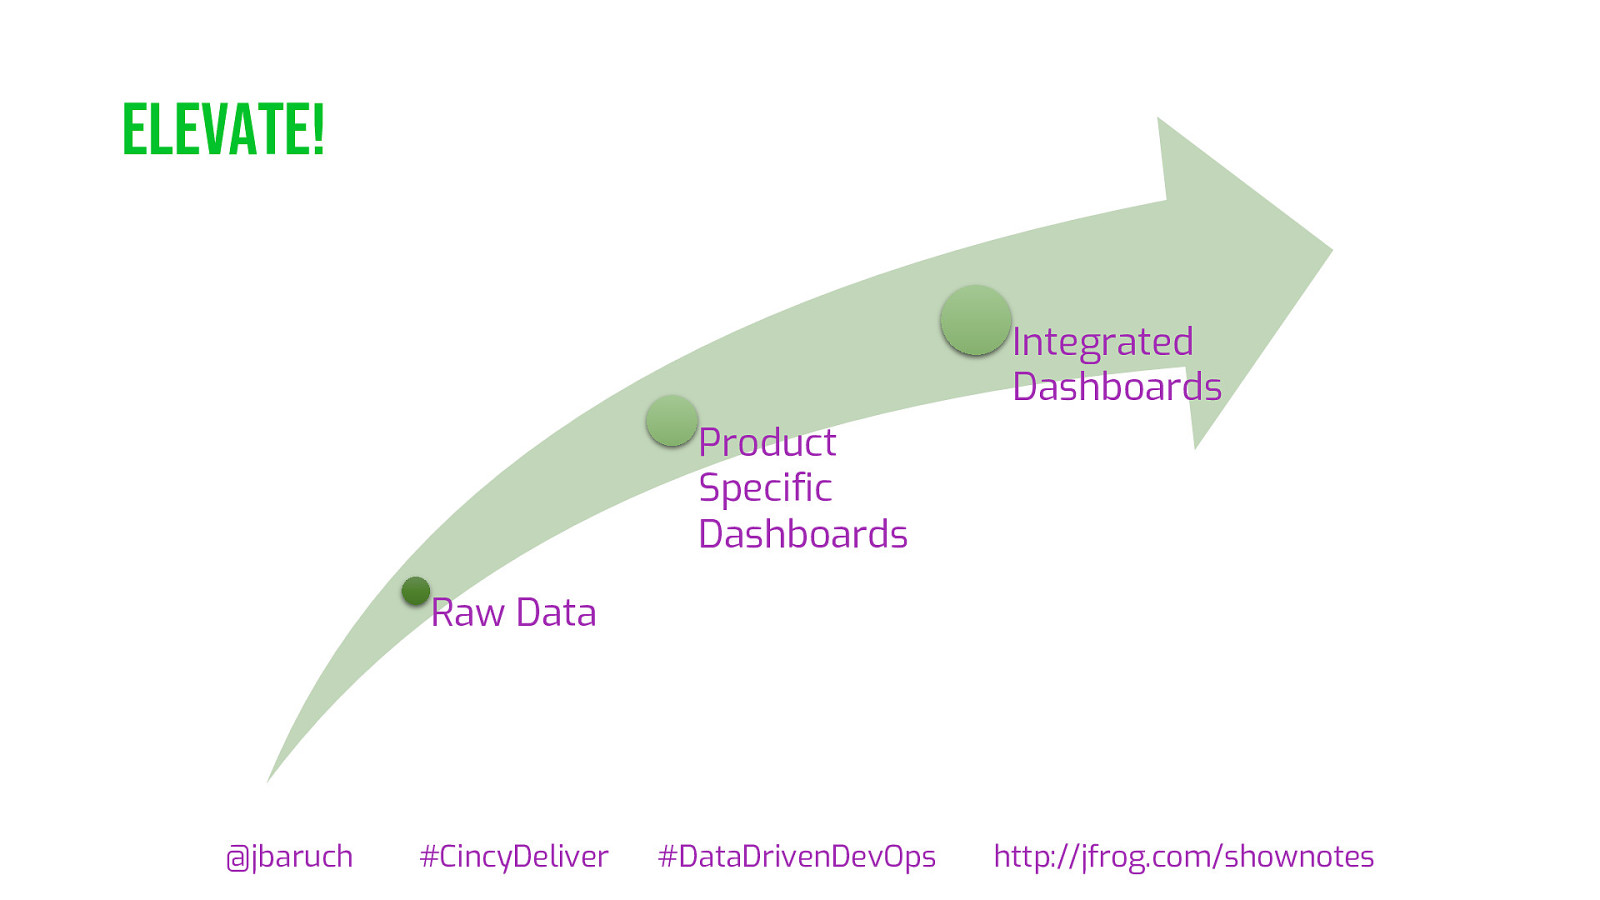
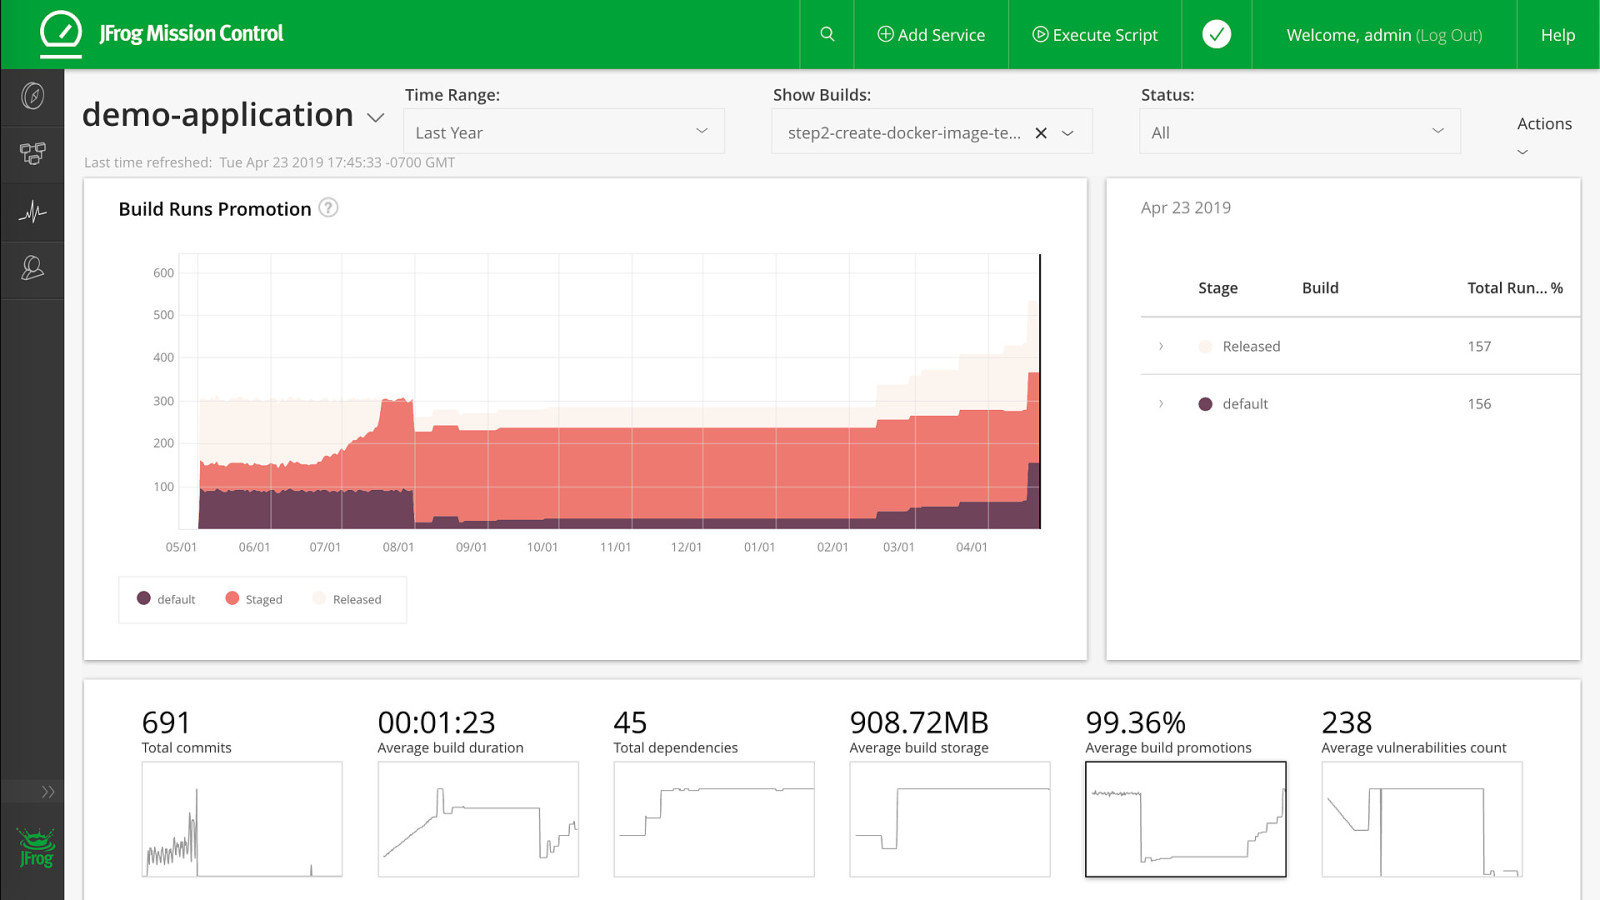
Elevate! Integrated Dashboards Product Specific Dashboards Raw Data @jbaruch #CincyDeliver #DataDrivenDevOps http://jfrog.com/shownotes
Slide 63
@jbaruch #CincyDeliver #DataDrivenDevOps http://jfrog.com/shownotes
Slide 64
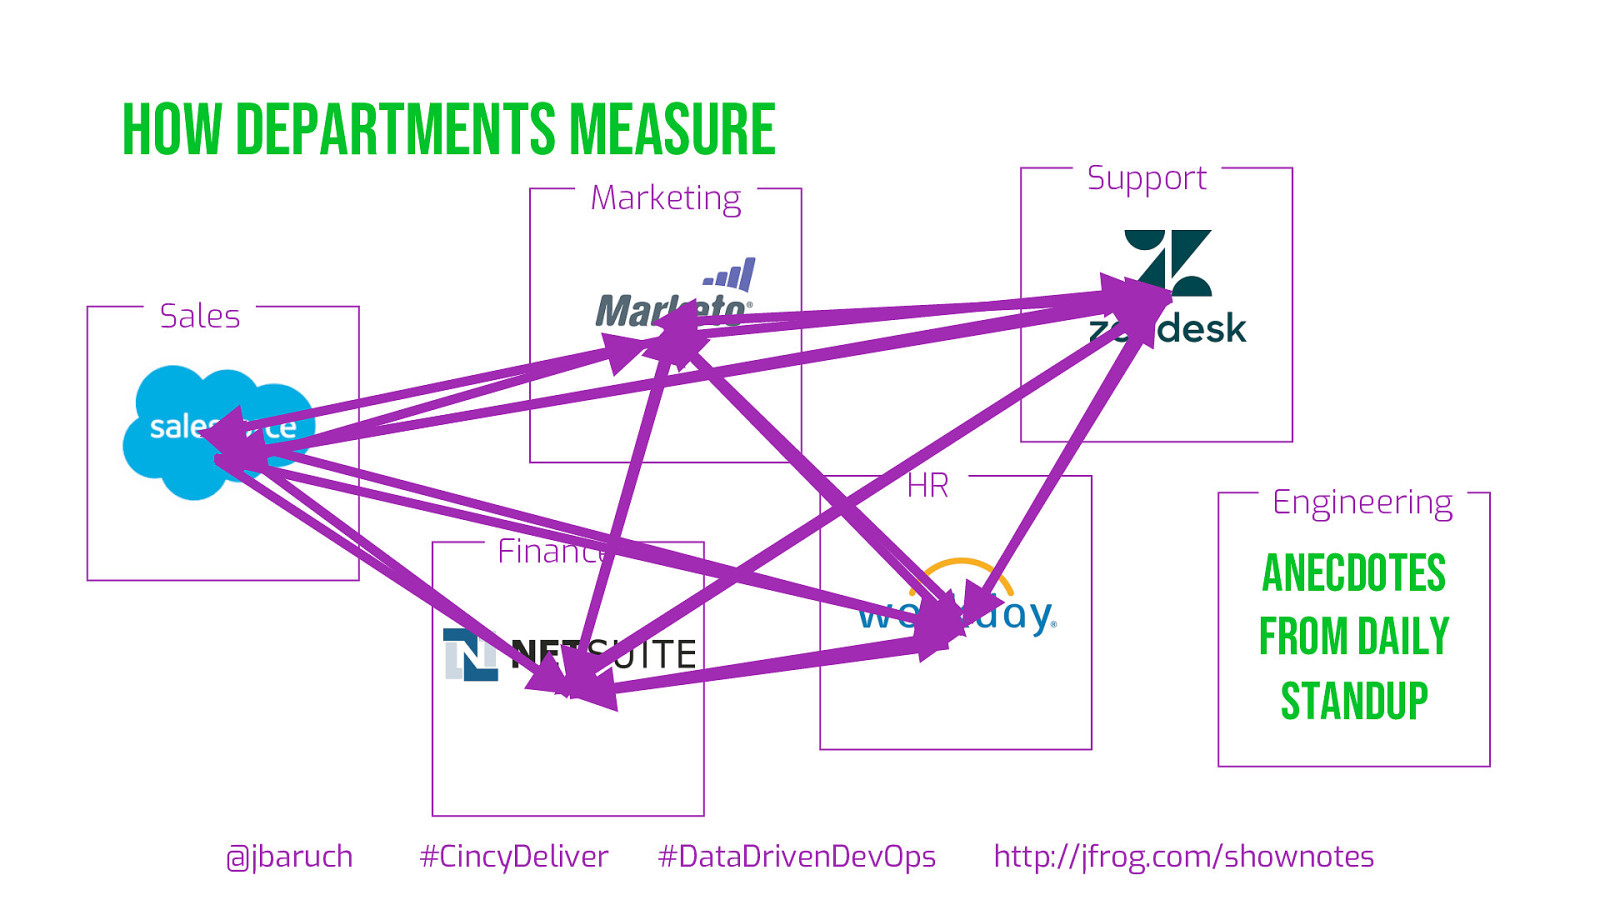
How departments measure Support Marketing Sales HR Finance @jbaruch #CincyDeliver Engineering Anecdotes from daily standup #DataDrivenDevOps http://jfrog.com/shownotes
Slide 65
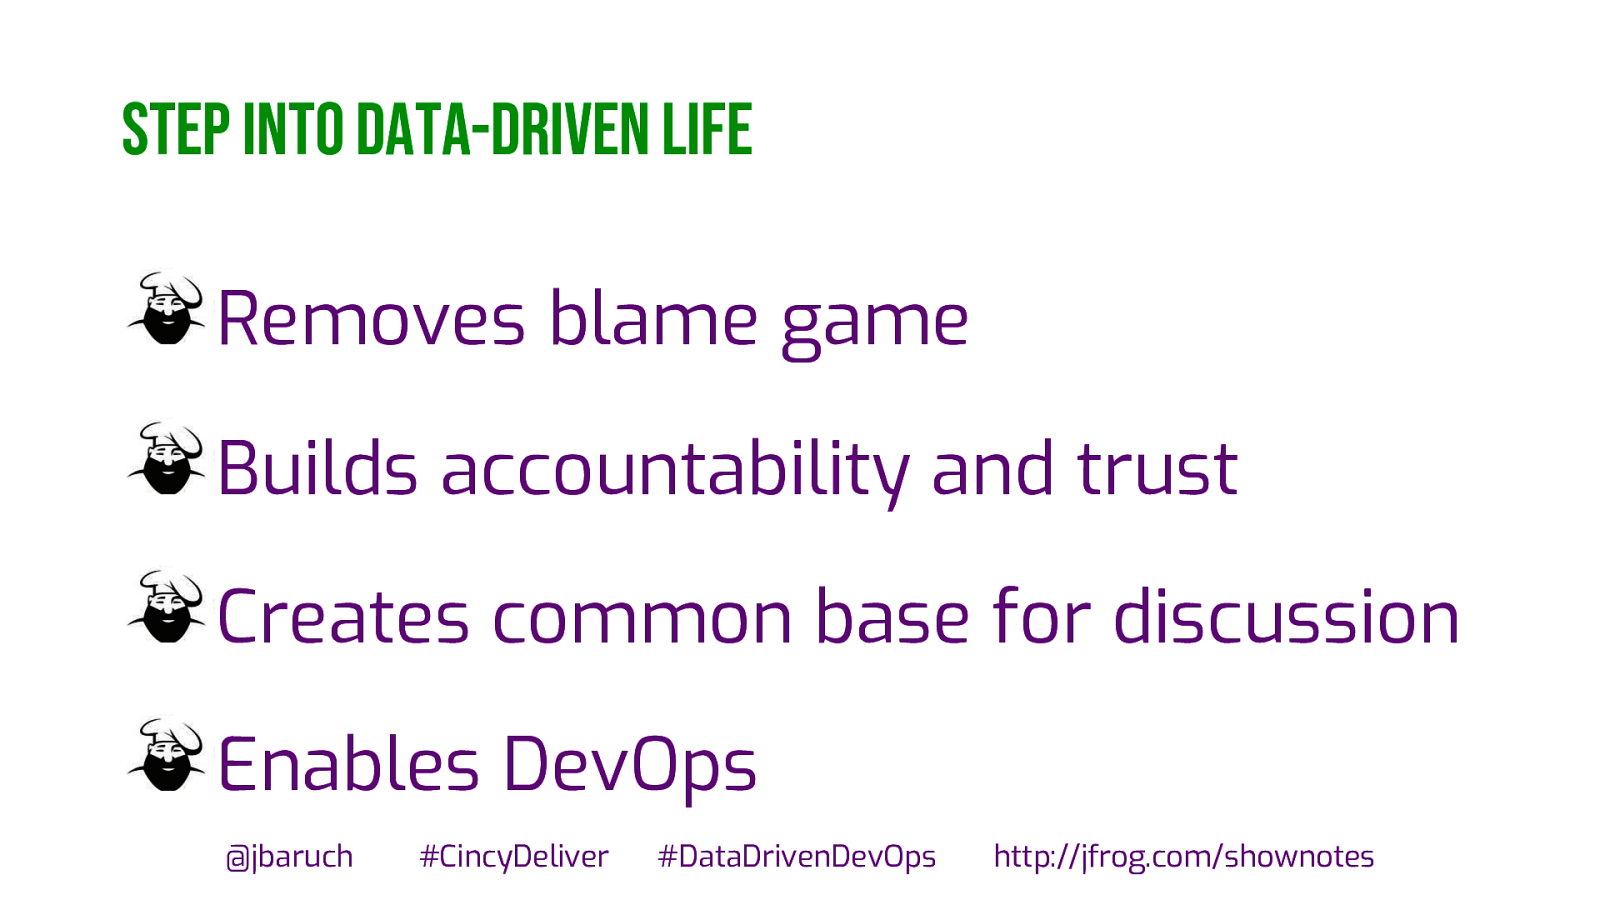
Step into data-driven life Removes blame game Builds accountability and trust Creates common base for discussion Enables DevOps @jbaruch #CincyDeliver #DataDrivenDevOps http://jfrog.com/shownotes
Slide 66
Q&A and twitter ads @jbaruch #CincyDeliver #DataDrivenDevOps http://jfrog.com/shownotes